
Tax Deductible IRA Contributions Across the Country
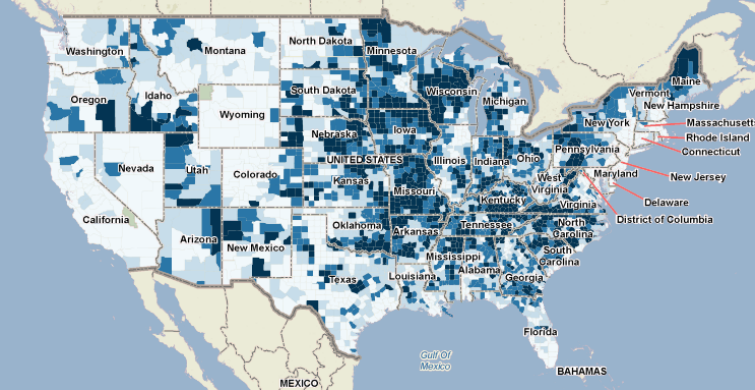
PolicyMap allows users to consider where people are contributing to their IRA accounts. By looking at the most recent data issued from the IRS for the 2005 tax year, users can view the percent of all IRS Tax Returns with IRA contributions at a state or zip code level. Among the states, Vermont leads the country with the highest percent of returns claiming an IRA contribution.

Maine follows at 3.24%, with Montana at a close 3.23%. The states with the lowest percentage of people contributing to their IRA accounts are Alabama, at 1.71% and Mississippi at 1.57%. Nationally, 2.63% of income tax filers made an IRA contribution in 2005.
New Jersey leads the country with an average IRA contribution of nearly $4,000 in 2005; up from $3,270 in 2004.

Washington, DC lags behind all the states in the average amount of IRA contributions at $3,041.
| States Ranked by Percent of Returns with IRA Deductions in 2005 | |||||
| Rank in 2005 | State | Percent of Returns with IRA Deduction in 2005 | Average Amount of IRA Deduction in 2005 | Percent of Returns with IRA Deduction in 2004 | Average Amount of IRA Deduction in 2004 |
| 1 | Vermont | 3.76% | $3,560 | 3.77% | $3,004 |
| 2 | Maine | 3.24% | $3,539 | 3.31% | $3,014 |
| 3 | Montana | 3.23% | $3,498 | 3.20% | $2,958 |
| 4 | New Hampshire | 3.15% | $3,568 | 3.25% | $3,013 |
| 5 | Oregon | 3.02% | $3,610 | 3.04% | $3,035 |
| 6 | South Dakota | 2.96% | $3,565 | 2.99% | $3,029 |
| 7 | Connecticut | 2.91% | $3,846 | 2.97% | $3,216 |
| 8 | Nebraska | 2.87% | $3,445 | 2.94% | $2,902 |
| 9 | Colorado | 2.82% | $3,557 | 2.91% | $2,947 |
| 10 | New Jersey | 2.82% | $3,951 | 2.90% | $3,270 |
| 11 | Rhode Island | 2.79% | $3,690 | 2.83% | $3,092 |
| 12 | Wyoming | 2.79% | $3,575 | 2.78% | $2,989 |
| 13 | New York | 2.78% | $3,754 | 2.86% | $3,115 |
| 14 | Idaho | 2.78% | $3,627 | 2.71% | $3,020 |
| 15 | North Dakota | 2.75% | $3,557 | 2.76% | $2,969 |
| 16 | Pennsylvania | 2.74% | $3,424 | 2.81% | $2,903 |
| 17 | Massachusetts | 2.73% | $3,672 | 2.86% | $3,100 |
| 18 | Iowa | 2.71% | $3,484 | 2.73% | $2,970 |
| 19 | Minnesota | 2.64% | $3,446 | 2.72% | $2,955 |
| 20 | California | 2.63% | $3,869 | 2.67% | $3,192 |
| 21 | Washington | 2.58% | $3,591 | 2.58% | $3,001 |
| 22 | Wisconsin | 2.55% | $3,396 | 2.62% | $2,900 |
| 23 | Maryland | 2.53% | $3,521 | 2.58% | $2,968 |
| 24 | Virginia | 2.44% | $3,520 | 2.50% | $2,943 |
| 25 | Florida | 2.44% | $3,700 | 2.49% | $3,082 |
| 26 | Kansas | 2.42% | $3,495 | 2.45% | $2,922 |
| 27 | Illinois | 2.34% | $3,677 | 2.40% | $3,087 |
| 28 | Arizona | 2.33% | $3,662 | 2.36% | $3,023 |
| 29 | New Mexico | 2.21% | $3,542 | 2.19% | $2,940 |
| 30 | North Carolina | 2.16% | $3,514 | 2.19% | $2,967 |
| 31 | Delaware | 2.16% | $3,553 | 2.20% | $3,027 |
| 32 | Missouri | 2.11% | $3,518 | 2.17% | $2,972 |
| 33 | Nevada | 2.10% | $3,663 | 2.15% | $3,054 |
| 34 | Indiana | 2.03% | $3,375 | 2.13% | $2,840 |
| 35 | Michigan | 2.01% | $3,371 | 2.07% | $2,875 |
| 36 | Utah | 1.99% | $3,606 | 1.97% | $2,970 |
| 37 | Ohio | 1.99% | $3,297 | 2.05% | $2,794 |
| 38 | South Carolina | 1.94% | $3,487 | 1.91% | $2,972 |
| 39 | Georgia | 1.93% | $3,545 | 1.98% | $2,969 |
| 40 | Arkansas | 1.93% | $3,783 | 2.00% | $3,204 |
| 41 | Oklahoma | 1.88% | $3,733 | 1.88% | $3,127 |
| 42 | District of Columbia | 1.86% | $3,041 | 1.90% | $2,548 |
| 43 | Louisiana | 1.84% | $3,727 | 1.91% | $3,055 |
| 44 | Tennessee | 1.84% | $3,525 | 1.89% | $2,934 |
| 45 | Texas | 1.82% | $3,784 | 1.85% | $3,120 |
| 46 | West Virginia | 1.78% | $3,311 | 1.81% | $2,796 |
| 47 | Kentucky | 1.76% | $3,506 | 1.85% | $2,955 |
| 48 | Alabama | 1.71% | $3,588 | 1.76% | $3,006 |
| 49 | Mississippi | 1.57% | $3,627 | 1.67% | $3,024 |
These numbers are based on statistics provided by the IRS for Federal Income Tax Returns and do not include any contributions to IRAs that are not reflected on income tax returns, or contributions to pensions or other employer retirement plans. (See Our Data for a complete description of the IRS Federal Income Tax Returns.)
![]()