
2008 Lending Trends and FHA-Insured Loans in Las Vegas
We’ve just posted the latest Home Mortgage Disclosure Act (HMDA) data recently released by the Federal Financial Institutions Examination Council (FFIEC) for 2008. Last year’s 2007 HMDA data clearly reflected the trauma in the housing market, and the 2008 data reveals ongoing difficulties, as well.
With the annual release of the HMDA data, the Federal Reserve Bank issues a publication of preliminary findings in which they discuss trends and changes in the data from years previous. This year, the Federal Reserve focuses on the prevalence of Federal Housing Administration (FHA) loans made in the second half of 2008. Here at PolicyMap, we decided to take a closer look at FHA lending across the nation to see where these changes were most apparent. We were particularly interested in FHA trends in light of the recent FHA audit that revealed cash reserve troubles (see this NY Times article for more information).
We took a look at the states with the highest percent change in FHA lending, and then dug deeper by considering the census tracts within those states to find the communities with the highest prevalence of FHA loans. Compared to the nation, whose FHA lending rose nearly 195%, California topped the list with a 4,415% increase, followed by Nevada, with a 2,036% spike. The only states with an increase of less than 75% were North Dakota and Mississippi, with increases of 53% and nearly 20%, respectively.
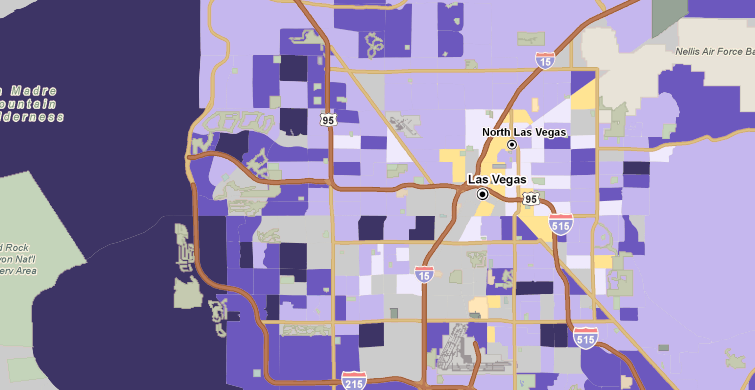
The census tracts with the highest increases in FHA lending were predominantly in the southwest. Clark county, NV, in which Las Vegas, NV sits, contains 13 census tracts with increases in excess of 1,000% in FHA lending:
| Census Tract | County, State | Percent Change | |
|---|---|---|---|
| 1 | 005821 | Clark, NV | 8420% |
| 2 | 003603 | Clark, NV | 6400% |
| 3 | 522745 | Maricopa, AZ | 6044.44% |
| 4 | 043805 | Riverside, CA | 6014.29% |
| 5 | 082014 | Maricopa, AZ | 5516.67% |
| 6 | 002963 | Clark, NV | 5433.33% |
| 7 | 005816 | Clark, NV | 5285% |
| 8 | 003203 | Clark, NV | 5006.67% |
| 9 | 422601 | Maricopa, AZ | 4250% |
| 10 | 005819 | Clark, NV | 4142.86% |
| Census Tract | County, State | Percent Change | |
| 11 | 043214 | Riverside, CA | 4116.67% |
| 12 | 007100 | Sacramento, CA | 3825% |
| 13 | 003301 | Clark, NV | 3466.67% |
| 14 | 061005 | Maricopa, AZ | 3380% |
| 15 | 031600 | Pasco, FL | 3360% |
| 16 | 082011 | Maricopa, AZ | 3320% |
| 17 | 901406 | Prince William, VA | 3175% |
| 18 | 002660 | Clark, NV | 3133.33% |
| 19 | 113009 | Salt Lake City, UT | 2960% |
| 20 | 901405 | Prince William, VA | 2800% |
HMDA data for 2004-2008 is available for free and can be located in the Mortgage Originations tab. The FHA loan data referred to above is available by navigating to Mortgage Originations and selecting “Government-Insured Loans”, then scrolling down to “By Government Agency”, “Loans Insured by FHA”, and toggling to %Ch in the legend. For more information about HMDA data, TRF’s calculations on HMDA data, and the Federal Reserve Bank’s assessment of the 2008 HMDA data, please see the HMDA entry in our Data Directory.
![]()