
Percent of Votes for Barack Obama in the 2008 Election
We’ve recently added some neat new demographic indicators to PolicyMap. We now have election data for the 2004 and 2008 national elections. Included are data for the Presidential, Senatorial, and House elections, as well the voter turnout rates. They are all available at the county and state level, except for the House of Representatives elections, which are available at the congressional district level.
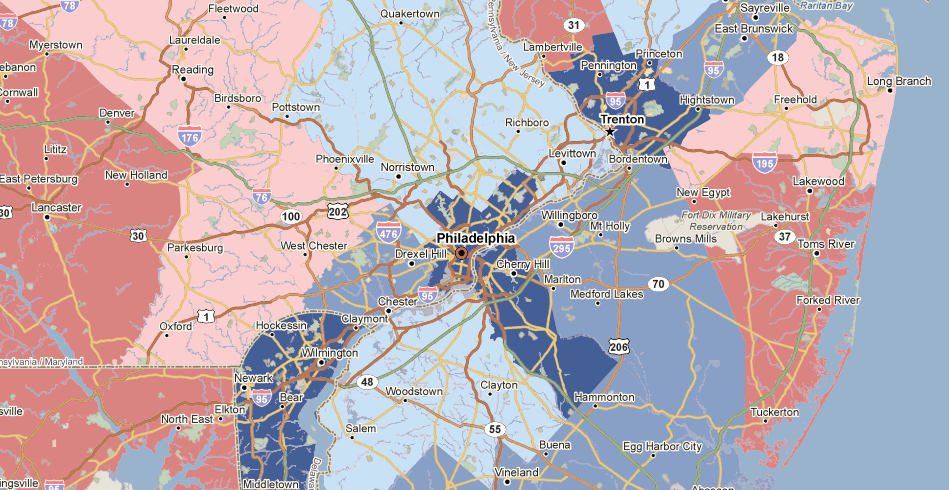
These indicators are available on the map in two formats. The first is the familiar red/blue map that most people are accustomed to seeing in popular media, where red represents areas won by Republicans, and blue represents areas won by Democrats, and darker shades representing larger margins of victory.
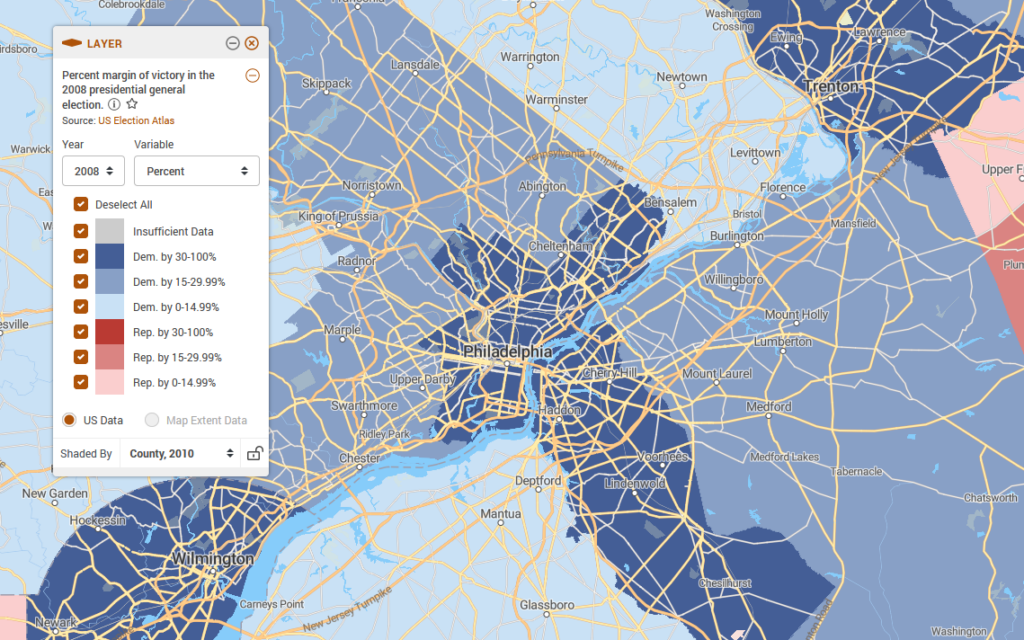
 For more in-depth data, however, click on either of the party-specific indicators below margin-of-victory.
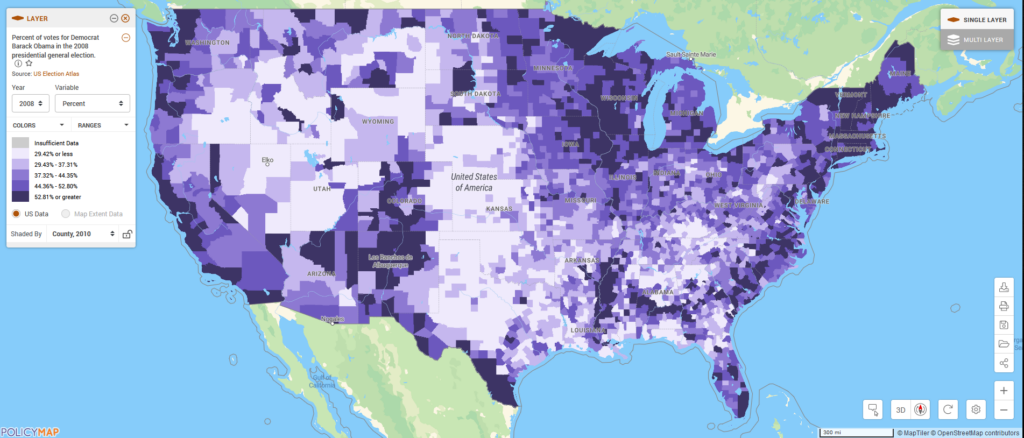
With these indicators, you get full PolicyMap functionality, including the ability to toggle between number, percent, and change in percent, the ability to edit ranges, and precise statistics for each geography (with margin-of-victory, you only get a range).
County/State/Percent of votes for Barack Obama in the 2008 presidential general election
| State | Percentage Change |
|---|---|
| District of Columbia, DC | 92.46% |
| Prince George’s, MD | 88.87% |
| Bronx, NY | 87.71% |
| Shannon, SD | 88.69% |
| Petersburg, VA | 88.64% |
| Baltimore City, MD | 87.16% |
| Macon, AL | 86.88% |
| Menominee, WI | 86.81% |
| Jefferson, MS | 86.71% |
| Claiborne, MS | 85.86% |
![]()