
2010 Free and Reduced-Price Lunch Update!
Among the many data updates going on here at PolicyMap has been a 2010 update of the Free and Reduced-Price Lunch (FRPL) data. Located at the bottom of PolicyMap’s Money & Income tab, FRPL represents the percent of students eligible for the National School Lunch Program, a federal program through which the United States Department of Agriculture subsidizes free lunch for students from families with incomes below 130% of federal poverty guidelines and reduced-price lunch when family income is below 185% of federal poverty guidelines. One of the most frequently called upon indicators measuring poverty within schools, FRPL is often used as a basis for determining funding allocations and Title I eligibility.
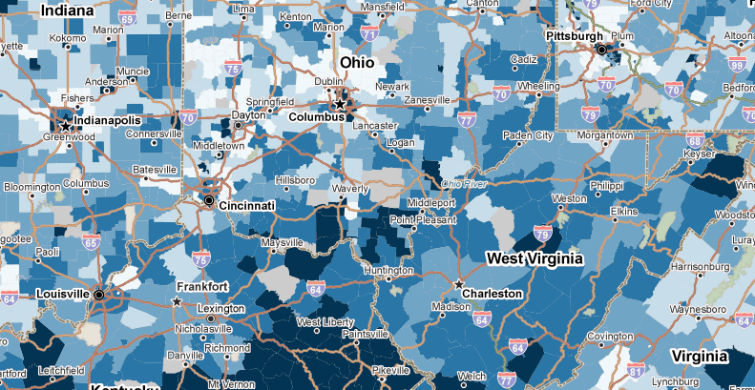
As seen in the map below, in a number of school districts, particularly in the South, more than 2/3 of school populations are eligible for free or reduced-price lunch.
Though perhaps the most commonly cited proxy for school poverty, researchers at the New America Foundation suggest FRPL functions as a more accurate indicator at the elementary and middle school levels than at the high school level. The reason for this is that, as a voluntary program, a significant number of high school students may choose to opt-out of the program to avoid the stigmas associated with poverty. Also, the Center for Public Education emphasizes the importance of not relying on one source of child poverty data, but rather benchmarking FRPL against other indicators.
Speaking of other school district-level poverty indicators, some PolicyMap users may be wondering why there is such a substantial difference between FRPL and the Small Area Income Poverty Estimates (SAIPE) data found on PolicyMap’s Education tab under “Population- Students in Poverty.” The main reason is that the criteria for poverty is much more stringent with SAIPE estimates than with FRPL. As two Census researchers explain, the Census’ SAIPE compares family income to federal poverty thresholds, which are primarily intended for statistical uses, whereas FRPL compares household income to federal poverty guidelines, which are largely used to assess eligibility for social programs. The researchers further conclude that “FRPL counts and poverty estimates measure different concepts due to the use of different income cutoffs (130% and 185% for FRPL as opposed to 100% for poverty), the use of different income periods (monthly for FRPL and annual for poverty), differences between school district enrollment and school district population, and varying FRPL program awareness across districts” (Cruse and Powers 2006). To read the entire study and learn more about the differences between Census and FRPL data, click here.