
Refreshed Boxwood Means home sale data on PolicyMap!
Update (06/09/2021): PolicyMap now has home sale data from Moody’s Analytics. Read more here.
You may notice some minor changes on PolicyMap to the recent home sale statistics in your community. Since this is one of PolicyMap’s most popular datasets we thought we should take the time to tell you why.
We strive to keep our data as current as possible, and for our home sale data this means about a six month lag-time. As you may have seen, we recently announced that 2011 annual numbers and 2011Q4 numbers are now available. This update includes the most recent numbers available on count of sales, median prices, aggregate sales amounts, and loan-to-value ratios in communities all across the country.
However, we have found that home sale information tends to trickle in slowly over time to our vendor, Boxwood Means. The reason for this is that county recorder offices often delay in posting transactions, or they post partial transactions without all the necessary information. To account for this lag, we refresh our annual and quarterly data about a year later. This allows us to adjust for any sales that were late to be reported, or that were reassigned to a different quarter once there was a final date of sale.
We have just completed a pretty sizable refresh. This includes the 2010 annual data, as well as the last two quarters of 2010 and the first two quarters of 2011. Are you curious to see if these updates have impacted your community? Login to PolicyMap and the data can be loaded from the Real Estate Analysis Tab. The home sale data is a proprietary data source available only to our standard and premium subscribers.
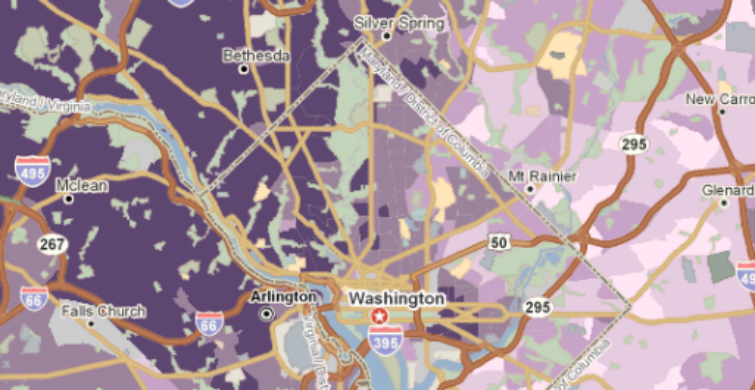
The map below showing the 2011 median sales price of a residential home in the Washington D.C. area can give you a quick sense of what boxwood has to offer.
