
Mapping Community Development Loans with PolicyMap
When PolicyMap was first conceived by The Reinvestment Fund (our parent organization), it was envisioned as a tool to help Community Development Finance Institutions (like TRF) do research for their lending activities. Community Development Finance Institutions (or CDFIs) are financial institutions that make loans in low-income (or otherwise underserved) markets. PolicyMap could help answer questions like: Where are underserved communities? Where can investment create successful development? What kind of investment would be most helpful?
For example, if a neighborhood lacks a supermarket, a CDFI can use PolicyMap to see where existing supermarkets are, and whether the neighborhood will be able to support a supermarket if it gets built. Or if an area lacks affordable housing, a CDFI can use PolicyMap to see if a new housing development will benefit the community.
Since PolicyMap started, our user-base has gone way past CDFIs, but our latest project harkens back to these beginnings, with the OFN Coverage Map.
The Opportunity Finance Network (OFN) is an umbrella organization of CDFIs, and they wanted to answer another set of questions: Where are CDFI investments being made? And where are they not being made? Where should existing CDFIs focus new efforts, and what areas have been successful so far? To answer these questions, they’re using PolicyMap to show where loans have been made by CDFIs across the country.
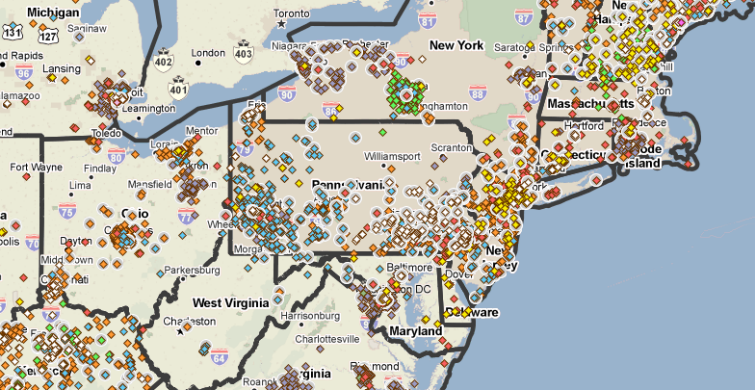
The tool shows points for every loan made, and is filterable by loan type:

Clicking on a point shows information about the loan:

To get a broader sense of the amount of loan activity in an area, you can open aggregations of the layer data. The map below shows number of loans by zip code:

And because it’s a PolicyMap widget, it has lots of our public data so users can get other relevant information about the area they’re looking at.
According to OFN, this map can inform:
- CDFI industry expansion strategies;
- Policy interventions based on market need and capacity; and
- Lenders and investors seeking to maximize the use of their resources.
The data comes from the CDFIs themselves, who opt to submit their loan data to the project. OFN manages the data collection process, and PolicyMap manages the data processing. CDFIs that might be interested in submitting their data should contact Lauren Stebbins at LStebbins@ofn.org. Since the map is only as good as the data in it, the more data it gets, the more useful it will be.
It’s a fun project for us at PolicyMap, since it combines the fun we have data processing with the community investment work being done by our colleagues. Think this is the kind of project your company or organization could use? Give us a shout!