
Fun with Taxes!
What can you tell about somebody based on their tax returns? You can find out how much money they make. You can find out how they make their money – Salaries and wages? Business? Investments? Retirement income?
Are they a low-income earner, receiving the Earned Income Tax Credit (EITC)?
You can find out about their family. How many dependents do they have? Are they claiming the child tax credit? Are their children going to preschool? Are they claiming the credit for child and dependent care expenses?
Do they own a home? Are they paying a mortgage?
Are they generous? Do they make charitable contributions? Are their homes powered by renewable energy?
Would it be rude to ask for a 1040 before going on a blind date?
Of course, you can’t look up tax returns for individual people (so don’t worry, no one will find out that you’re deducting millions of dollars in local sales taxes due to your $5,000-a-day Faberge egg habit). But data from the returns are aggregated together, so you can see the collective tax returns for entire ZIP codes, counties, and states. This data comes from the IRS’s Statistics of Income (SOI) dataset, new on PolicyMap.
If you’re thinking that this data seems familiar, we had IRS SOI data for many years, until the IRS took a multi-year hiatus in releasing new data. For the last year, we’ve had data from a 3rd-party data provider, Powerlytics. But now, the IRS is releasing SOI data again, and we’re providing this data straight from the source.
What makes the IRS data special is its administrative data. It’s not collected for the purpose of collecting data, it’s collected for the purpose of collecting taxes. There is no margin of error – this isn’t a survey. This is all the tax returns. Well, almost all the tax returns. Some data is suppressed because there are so few returns in a ZIP code, the data might tell you something about an individual. Another thing to keep in mind: The ZIP code data is based on the ZIP code the filer puts on their form. Some people don’t enter the right ZIP code. And of course, there is the itty bitty possibility that some people might lie on their income tax returns.
The menu layout has been rejiggered to put the data in logical categories, based on the 1040 form. The first section is Sources of Income. This has data on salaries and wages, business income, and unemployment compensation, as well as various types of investment income, and retirement income. Keep in mind: this only includes taxable income. Some Social Security benefits, for example, are not taxed, and won’t be included in these totals. Here’s where the data comes from on the 1040:

Adjusted Gross Income comes from the next section on the 1040 (line 37 below). It’s the total income, minus various deductions including educator expenses, HSA expenses, alimony paid, IRA deductions, student loan interest, tuition, and a whole lot more (though the IRS doesn’t make any of this available, except contributions to self-employed retirement plans). You can see that whole section here:

The next section is where the good stuff is. Credits and deductions. This is where there are deducted expenses like child and dependent care expenses, residential energy, home mortgage interest, and gifts to charity.

What’s the difference between a credit and a deduction? In order to qualify for a deduction, you need to itemize your deductions, forgoing the fixed-rate standard deduction. So, if you’re single or filing separately, and your itemized deductions don’t add up to $5,950 (in 2012), you’d just take the standard deduction, and not report any itemized deductions. So anything in the Deductions section only applies to filers who have itemized. Many more people might have made charitable contributions, but they weren’t reported. In general, homeowners are more likely to itemize their deductions, because they can claim the Home Mortgage Interest deduction.
Credits, on the other hand, apply to anyone who files.
Below that, there’s a section called “Payments”—this is where you’ll find data on the Earned Income Tax Credit and Additional Child Tax Credit. Since these are called “Credits”, why are they in the section called “Payments”? Credits, in the “Credits” section, can’t add up to more than the taxes owed. You can’t get money back from the IRS through credits. The EITC and the Additional Child Credit, however, are payments from the government. Even if a filer owes no taxes, they can get a check back from the IRS if they’re owed these payments.

The last section on PolicyMap is poetically titled “Taxes Files, Taxes Paid”. This includes basic information on the number of filers, number of exemptions (people the return covers), number of dependents, and whether the taxes were signed by a paid preparer. It includes the income tax totals, which is pretty much a map of where the government gets its money. There’s also data here on the Alternative Minimum Tax (AMT), which is a good indicator of where people are wealthy, and claiming a lot of credits and deductions.
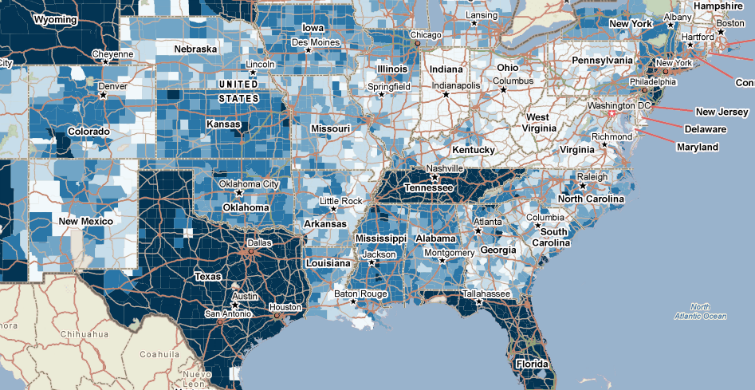
Lastly, in this section, there are indicators on overpayments and underpayments. Overpayments result in tax refunds, and underpayments mean the filer has to write a check. People in the darker shaded areas in the map below may have a little extra spending money come late April:
