
Affirmatively Furthering Fair Housing

Data
Racially/Ethnically-Concentrated Areas of Poverty
Source
Find on PolicyMap
- Federal Guidlines
- Housing and Urban Development
- Fair Housing
- Racially/Ethnically-Concentrated Areas of Poverty (R/ECAP)
More than two years ago, President Obama and the Secretary of Housing and Urban Development, Julian Castro, introduced a revision to the Fair Housing Act that seeks to “affirmatively further fair housing” (AFFH) by requiring HUD grantees to take active steps toward “overcom[ing] historic patterns of segregation.” As outlined in the President’s Final Rule, a key component of this initiative was the provision, by HUD, of demographic, economic, education, health, employment, transportation, and other data, mapped out so as to reveal patterns of segregation that may have been previously unseen or unknown to grantees and policymakers. We’re excited to announce that much of HUD’s AFFH data is now available on PolicyMap. It can be found under the Federal Guidelines>Fair Housing tab.
One of the data layers most pertinent to AFFH is racially/ethnically concentrated areas of poverty (R/ECAP). R/ECAP areas are census tracts where more than half the population is non-White and 40% or more of the population is in poverty OR where the poverty rate is greater than three times the average poverty rate in the area (with revisions to these formula for non-urban areas). We now have HUD’s official nationwide R/ECAP data from 2010, 2000, and even 1990. All data are at the 2010 boundaries (HUD adjusted the data from 2000 and 1990 to the 2010 boundaries using the Brown Longitudinal Tract Database) and are displayed at census tract geographies. The release of these historic data allows us to look at where the intersections of race and poverty have changed over time.
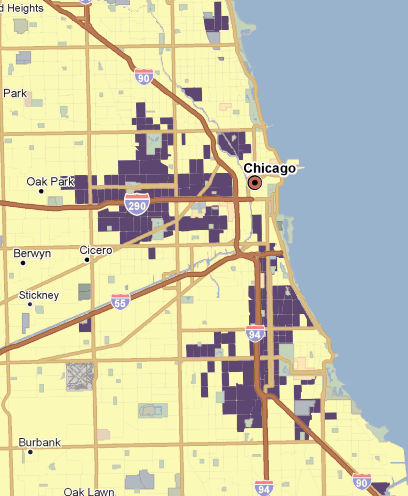
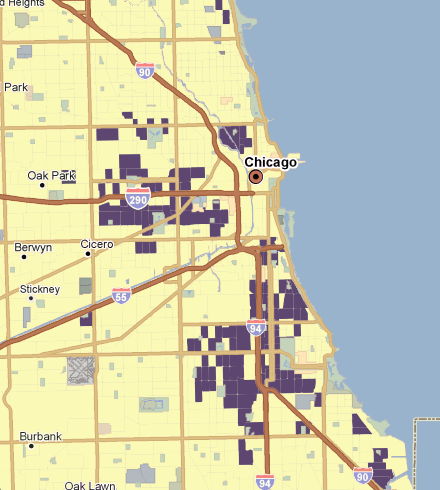
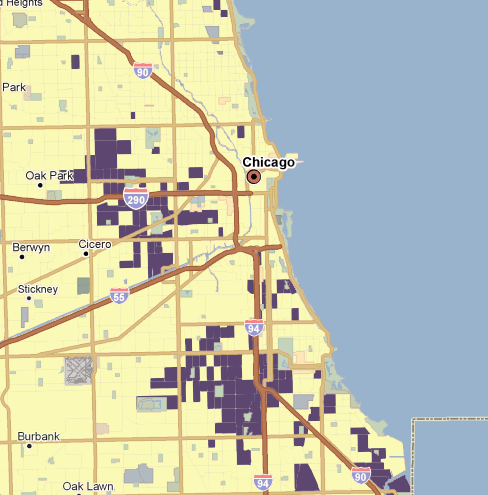
One of the imperatives in the AFFH final rule is to address entrenched patterns of segregation. In light of this focus, it makes sense that the announcement by HUD Secretary Julian Castro of the Final Rule came in Chicago, and much discussion around AFFH has focused on the narrative of economic and racial segregation in this city. Using the historic R/ECAP boundaries from 1990, 2000, and 2010 available on PolicyMap it is plainly clear how little the areas where poverty and race intersect in Chicago have changed over the last 20 years.
While it appears that the areas surrounding Chicago’s downtown (the “Loop”) – approximately where that orange dot for Chicago sits on the map – have shifted away from R/ECAP status over the last two decades, the large areas of concentrated poverty and non-White populations have remained a defining characteristic of the city’s South Side and neighborhoods to the west of downtown.
In addition to the historic R/ECAP data, we have also added 7 of HUD’s Opportunity Indices to PolicyMap. One example is the “School Proficiency Index,” also found under the Federal Guidelines>Fair Housing tab. This index provides a summary measure of nearby elementary school performance. HUD uses a number of metrics to develop this block group-level index including 4th grade school performance and attendance figures. The index ranges in values from 0 to 100, with the highest values indicating the highest school performance.
Similar to the spatial disparities we see in the R/ECAP data from Chicago, there are significant access questions when it comes to high quality education. Using the Los Angeles area as an example, we see a metropolitan area where large swaths of the city have access only to low-performing elementary schools, particularly in the neighborhoods surround the city’s center, while other parts of the metro-area, particularly west of the city along the coast, appear to have very good access to high-quality elementary education.
In addition to the school proficiency index, you will also find Opportunity Indices related to environmental health, jobs proximity, transit trips, transportation costs, low poverty and labor market engagement. These data from HUD get at some of the larger questions around the geography of affordable housing, and similar analyses can be conducted for other cities and metropolitan areas using PolicyMap.