
Aging Infrastructure: Structurally Deficient Bridges by County and Congressional District

Data
Structurally Deficient Bridges
Source
USDOT
Find on PolicyMap
- Economy
- Infrastructure
- Transportation
- Infrastructure
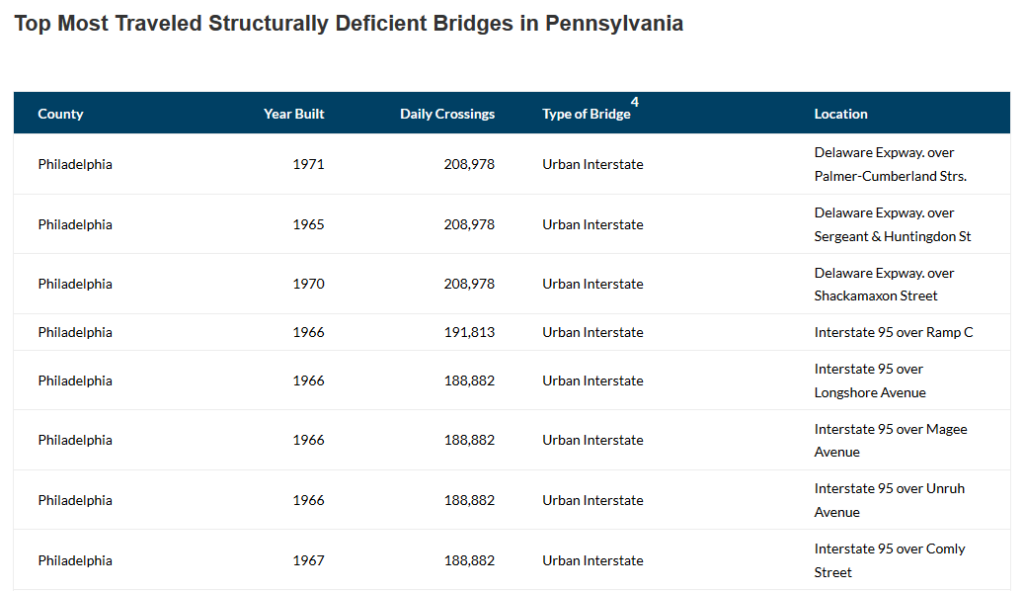
As a resident first of Rhode Island and now of Philadelphia, I know all about the challenges of driving on I-95. Loads of 18-wheelers, tons of east coast traffic, potholes. Indeed, I-95 is no stranger to the nation’s nagging aging infrastructure woes. The list below, provided by the American Road and Transportation Builders Association, illustrates that many of Pennsylvania’s most traveled structurally deficient bridges are in fact on the great I-95.
Given the continued buzz around aging infrastructure, fueled by events like the recent Oroville Dam disaster, we recently added new data layers to PolicyMap which allow you to see the percent of bridges that are structurally deficient or functionally obsolete in a given county subdivision, county, congressional district, metro area or state. The map below shows that congresspeople in Pennsylvania and Iowa have a steep hill to climb when it comes to troubled bridges; a large number of districts in those states show one in five bridges to be structurally deficient.
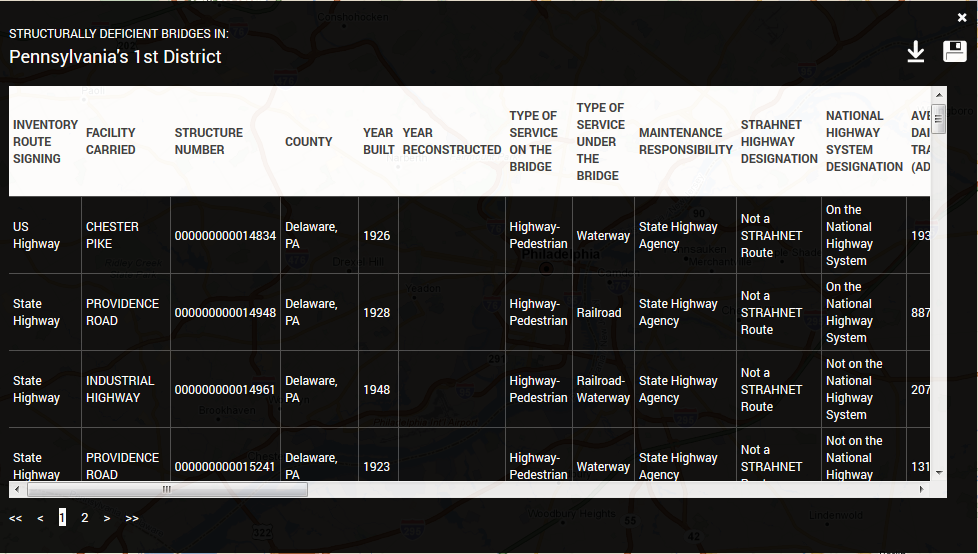
If you are interested in seeing a list of bridges in your congressional district, you can add the point level bridge data to the map as well and then click on your district to access a downloadable list of all the structurally deficient bridges.
The data is from the National Bridge Inventory (NBI), a database of more than 600,000 bridges compiled in 2016 by the Federal Highway Administration. We will continue to be on the lookout for additional data related to aging infrastructure to add to PolicyMap. In the meantime, be safe driving down 95!