
What’s New in Mortgage Lending: An Analysis of 2016 HMDA Data
Data
Mortgage Lending
Source
FFIEC: HMDA
Find on PolicyMap
- Lending
- Mortgage Loans
- Mortgage Loans By Race or Ethnicity
- Mortgage Loans By Income
For most Americans, mortgage debt is the largest component of household debt. The access a household has to different types of mortgage credit plays a significant role in the household’s financial well-being.
The Home Mortgage Disclosure Act (HMDA) requires financial institutions to publicly disclose detailed information about all the loans made each year, and is a valuable source of information on the mortgage market. It includes details about the type, purpose, and the characteristics of the loan, the census tract income related to the loan, as well as demographic and other information about the mortgage applicant. This data, published each year by the Federal Financial Institutions Examination Council (FFIEC), can be found throughout PolicyMap’s Lending menu.
The most recently released data is from 2016, and a few of the big takeaways include:
More Loans, More Expensive Loans
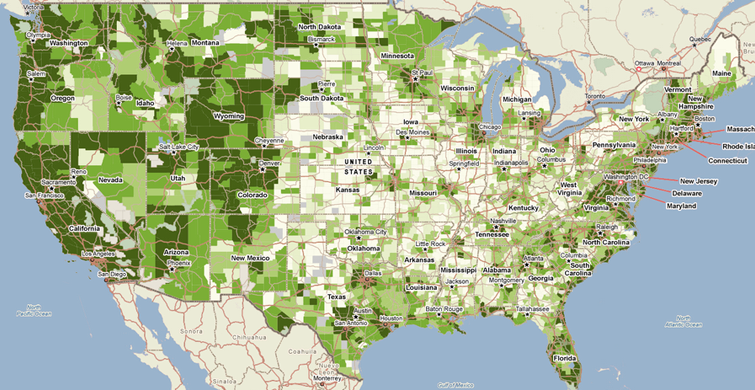
The number of mortgage originations is up by 16%, driven by an increase in both home purchase and refinance loans. Paralleling the rising housing costs experienced throughout the nation, the median value for home purchase loans increased to $208,000. The map below shows that the west coast and certain parts of the east coast have seen quite an increase in home loans over the last two years.
More Loans for Minority Borrowers
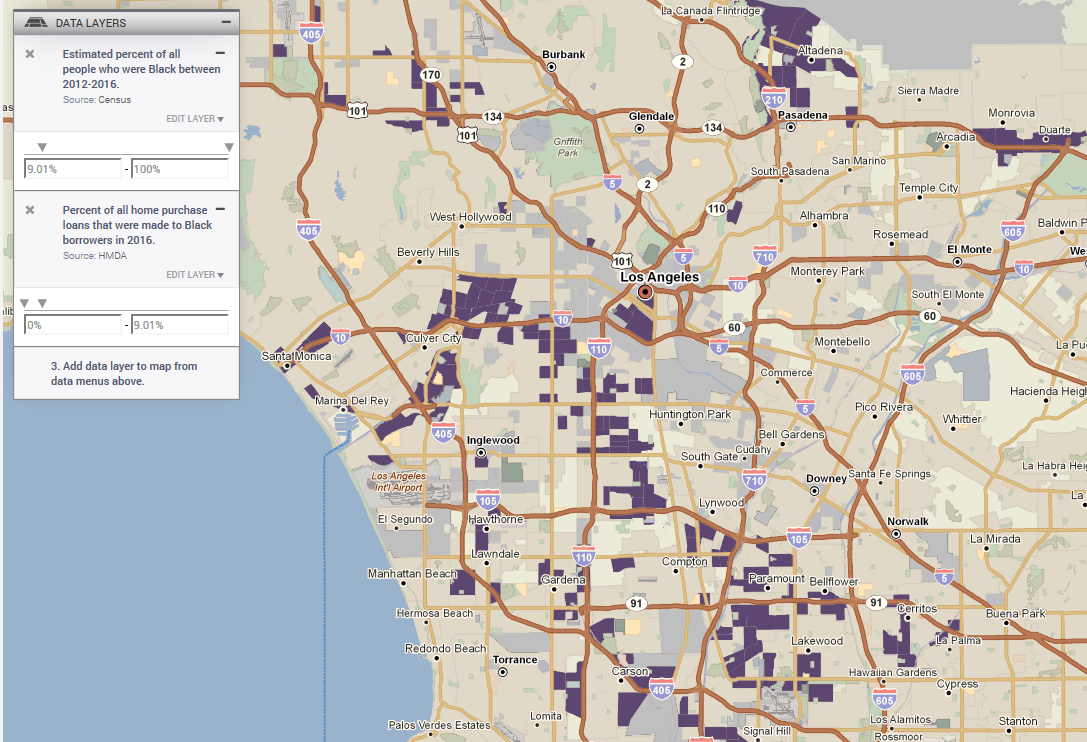
Another trend that continued to unfold in 2016 was that Black and Hispanic borrowers are comprising a growing share of both home purchase and refinance loans. While this is good news in terms of addressing the wealth gap associated with inequitable homeownership rates along racial/ethnic lines, mortgage loans for people of color are still being made at a lower rate than for White non-Hispanics. There are still many areas where Black and Hispanic households receive a disproportionately low share of mortgages. For example, the 3-Layer Map below shows areas in Los Angeles where Black people are receiving proportionally fewer home purchase mortgages than their share of the population.
More Government-Insured Loans
HMDA also tells us which types of mortgage products various types of borrowers are getting. Another trend unfolding since the recession is that government-insured loans continue to comprise a large share of the mortgage market for all demographic groups, and are increasingly common amongst Hispanic and Black borrowers. Government-insured loans include those insured by the Federal Housing Administration (FHA), Veterans Affairs (VA), Farm Services Administration (FSA), or Rural Housing Services (RHS). Such loans, generally referred to as nonconventional loans, typically involve high loan-to-value (LTV) ratios, which basically means that the down payment required is fairly small. While growth in FHA and other nonconventional loans certainly suggests an increase in access to credit for lower-income borrowers, there are other implications of this trend worth exploring.
The chart below shows that while all demographic groups have seen an increase in government-insured loans since the recession, non-Hispanic Black borrowers are currently twice as likely to have nonconventional loans than their non-Hispanic White counterparts.
Fewer Loans to Low- or Moderate-Income (LMI) Borrowers
One final trend worth pointing out is that the share of home purchase loans to low- or moderate-income (LMI) borrowers decreased in 2016 by about 2%. A contributing factor is that the high credit standards since the housing crisis continue to make it difficult for individuals with less than perfect credit to get access to a mortgage through the Government-Sponsored Enterprises (such as Fannie Mae and Freddie Mac). Researchers at the Federal Reserve Bank of Dallas explore this decline in home purchase lending by the largest banks to LMI borrowers in this article here.
Anyone interested in reading more about the national trends in the 2016 HMDA data should check out the following Federal Reserve Bulletin.