
Don’t Do the Crime If You Can’t Spend Some Time
Some datasets are easier to process than others. Anything from the BLS is a joy. ACS is a months-long process. But crime data from the FBI is just about the craziest dataset we process.
The FBI provides offense data that we make available at the county and city level, with indicators on violent crimes (murder, rape, robbery, and aggravated assault) and property crimes (burglary, larceny, motor vehicle theft, and arson). The data comes from the Uniform Crime Reporting (UCR) Program, which collects standardized crime data from police agencies nationwide.
The data is helpful for tracking local trends (which is particularly important when public figures are making claims about current crime levels) and comparing crime rates across areas.
There are a lot of components that go into the levels of crime reported, and questions about what a high crime rate means for an area. But today, we’re just going to look at the data itself.
Getting the file
The FBI’s UCR website has certain data available at the county and city level, but we can’t use it for a number of reasons. Neither file has any standard identifier code (99.9% of the data we get comes with a FIPS code), and the county file excludes crimes recorded by cities within the county.
Instead, we get the data by requesting it from what appears to be a secret FBI e-mail address. I can’t tell you the address. Within a few hours, we get a response from an anonymous FBI employee with the data file. You can respond with questions, which they’ll answer, but they never include a signature. The FBI is serious.
The file
The data file is a thing of beauty. And horror. It’s amazing.
It’s a text file. It looks like a file format introduced in the early 80’s, like something that might come out of your dot-matrix printer.
Upon opening the file, you are greeted with this:
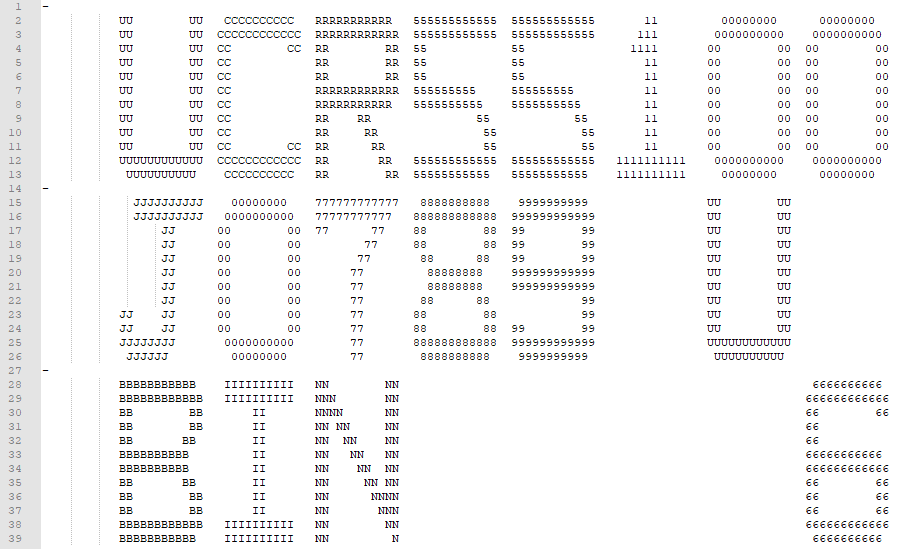
That’s right: ASCII art.
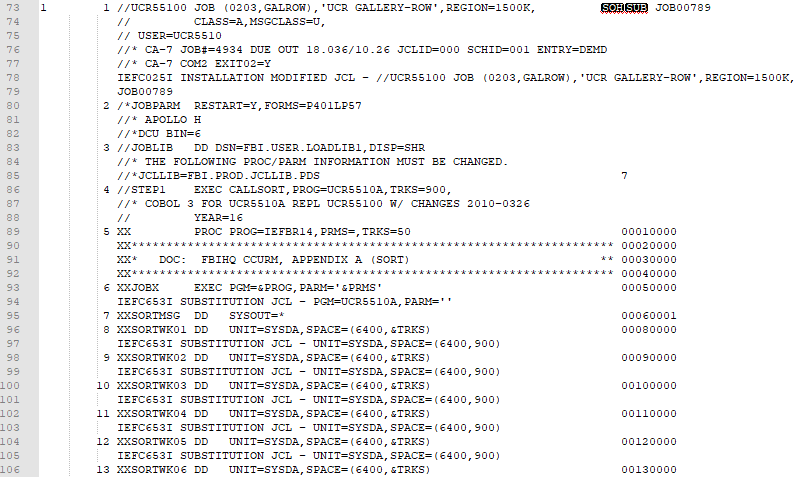
The next couple hundred lines are complete gibberish. For all I know, they contain classified information about the JFK assassination. Hard to say.
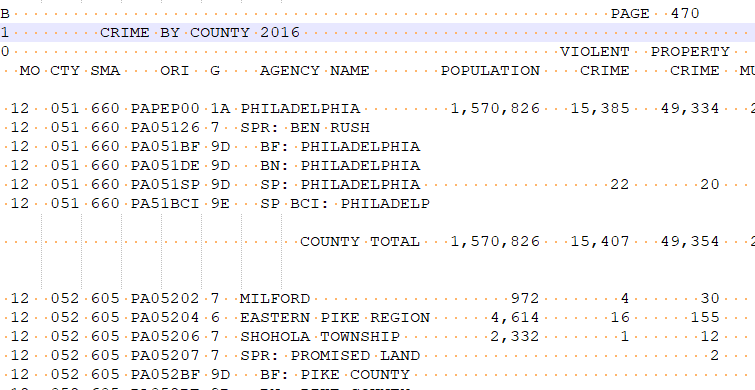
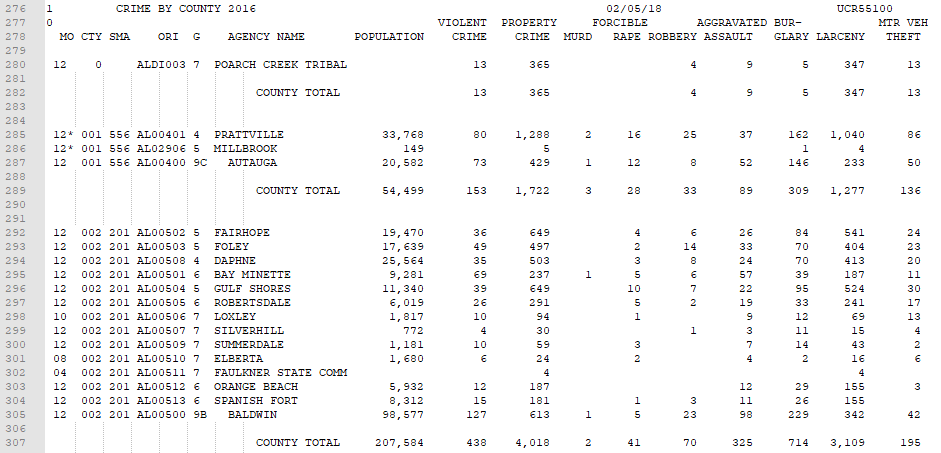
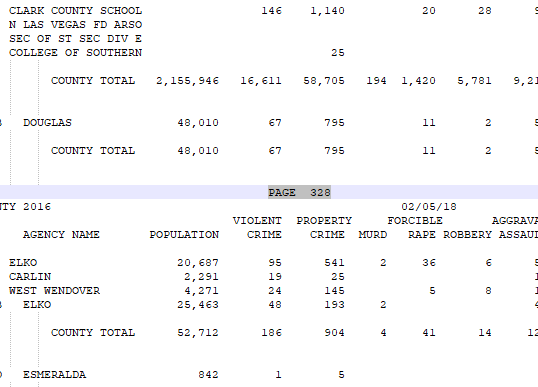
Scroll down to line 276, and that’s where the actual data begins. It’s fixed-width delimited, with columns for the various types of crime and rows for every police agency.
Oh, and this text file has page numbers:
But hey, we build some scripts to clean up the extraneous stuff, and it’s delimited, machine readable data. Can’t complain.
Identifiers
Let’s look at the data for Philadelphia, which is a city and a county with the same borders.
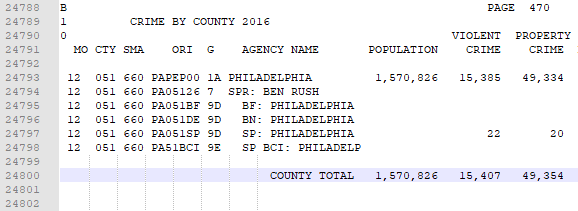
Each row represents a different law enforcement agency. The first row of data is the Philadelphia Police Department. The other rows represent offenses reported to state police, transit police, campus police, park rangers, etc.
One thing you might quickly notice: No FIPS codes. Not for the city, not for the county. In fact, the row for the county has no identifiers at all. The “CTY” column is a unique county identifier, but doesn’t correspond with commonly used FIPS codes. And the “ORI” column is a unique identifier for the police agency, but not for a city.
In the e-mail containing the data file, there’s also a PDF file called “county codes”. It’s a scanned PDF with a header saying “UCR-CONVERT-UCR-COUNTY-TO-FIPS”:
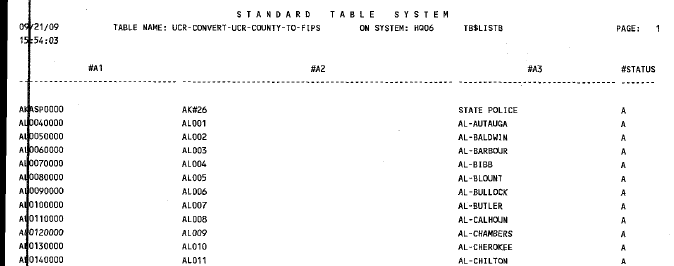
This goes on for 62 pages. Because it’s a scanned PDF, it can’t be imported into a database without either manual entry, or using OCR technology, which can be tricky with data. But it doesn’t matter. None of these columns contain FIPS codes. Baldwin County’s FIPS code is 01003. So, since this document doesn’t actually have usable information, we’re spared from having to convert this document into data.
The Crosswalk
Fortunately, the Inter-University Consortium For Political and Social Research (ICPSR) makes available a crosswalk table, which originally comes from the National Archive of Criminal Justice Data. It provides translation codes for both the “CTY” column to county FIPS codes, and from the “ORI” column to individual municipalities.
The crosswalk that we use is from 2005, which means it’s starting to age. The good news is that counties don’t change very much, so the county data doesn’t suffer from obsolescence. The city data does a bit, but major cities have stayed pretty much the same. There is a newer crosswalk table, made in 2012, but for technical issues not even worth getting into here, we’re not able to use it.
Yet quirks remain
Looking back at the Philadelphia data, you’ll notice one odd quirk:
The number of crimes reported to the Philadelphia Police Department (which is crosswalked to the city of Philadelphia) and the county are different, due to the crimes reported to state police on the second to last row. Remember, the city and county of Philadelphia are the same, and yet the data for each of them is different.
Also, New York is a problem. New York is a city comprised of five counties. The city has a single police department covering five counties. Therefore, there is no county crime data for New York City, only city-level data.
There are other things to keep in mind. The FBI’s definition of “rape” changed in 2013. You can read the details about that here. Not all agencies immediately adopted to the new definition, so the data reflects a mix of definitions.
The FBI also strongly cautions against using the data to rank areas. According to them, “Data users should not rank locales because there are many factors that cause the nature and type of crime to vary from place to place… Ranking ignore the uniqueness of each locale.” You can read their whole statement here.
Another obvious shortfall of the data is that a lot of people are interested in where in cities crime takes place. Unfortunately, there’s no national data source on crime locations. There are some data services that attempt to make nationwide maps of local crime based on demographics, but many of them make assumptions we’re not comfortable with using.
So why is this data released in the way it is? Is the technology at the FBI really so antiquated? I can only speculate, but I think it’s possible that it’s purposefully obfuscated and made difficult to access to limit the widespread circulation of the data. This data is easy to misuse, and misunderstand, and the FBI is particularly concerned with people combining it with clearance data (basically, arrest data) to determine which police departments are most effective. By making the data difficult to access and use, it forces data users to really understand the data before delving in.
Now that you understand the data, you can access it in PolicyMap’s “Quality of Life” menu. It’s available to all users.