
June 2018: Visualizing the Geography of Environmental Justice
Visualizing the Geography of Environmental Justice
When University of Delaware sociology professor Victor Perez teaches his students about environmental justice, he brings up a map of Wilmington, Delaware. The map shows points where there are brownfields, contaminated remnants of abandoned or underused industrial or commercial operations. Then, he adds shading to the map to show areas of the city with high levels of poverty. Almost all the brownfields are in the shaded areas.

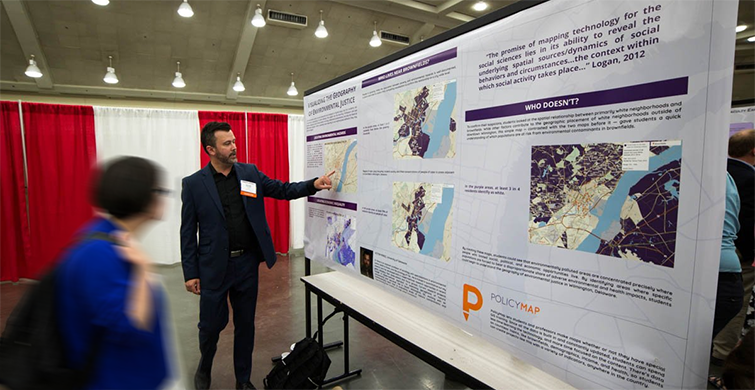
We just had the pleasure of co-presenting a poster on this subject with Dr. Perez at the Special Libraries Association Annual Conference. The SLA’s Social Sciences & Humanities and Academic Divisions hosted a poster session, and we thought this would be a good opportunity to bring Dr. Perez’s work to a wider audience.
In addition to discussing how brownfields represent a legacy of environmental injustice, Dr. Perez talked about how PolicyMap has “transformed” how he’s able to teach the subject. Not being a geographer, and having students with a variety of majors, he said he wants to spend time on the content of his lesson, not on the technical aspects of making a map.
Instead of spending hours sourcing the data and designing a map with GIS software, he just opens the data in PolicyMap. He can then easily show similar situations in other parts of the country, or open other indicators that further illustrate the idea.
If you’re interested in seeing the poster, click here to download a PDF (though be warned: it was designed for an 8 by 4 foot poster, so you have to zoom in to see anything).
You can also see a video of Dr. Perez using PolicyMap in his class here.
Click here to see if your university has access to PolicyMap.

The Challenges of Processing FBI Crime Data
County and city level crime data from the FBI is an oddly complicated dataset to process. From ASCII art to a lack of identifiers, there are a number of obstacles that need to be overcome to display the data on a map.
 How To: Joining Data to a List of Addresses
If you have a list of addresses, it can be incredibly useful to find underlying geographic data for these addresses. This data might be neighborhood demographic or income conditions, or government eligibility indicators, like NMTC or CRA eligibility. This can be done easily in PolicyMap.
New and Updated Data
All updates include the latest available data.
- Qualified Opportunity Zones from the CDFI Fund are updated to include all states.
- Medicare beneficiary, utilization, and cost data from the CMS is updated to 2016.
- USDA Rural Multifamily Housing property locations are updated to April 2018.
- CFPB Rural or Underserved designations are updated to 2018.
- Homelessness data from HUD is updated to 2017.
- Drug overdose death data from the CDC is updated to 2016.
- School and school district performance data from GreatSchools is updated with the latest test results from 2011 to 2017. (Subscriber only)
- School district finance data from the Census, including indicators on revenues, expenditures, debt, and assets, is updated to 2016.
- Credit union branch locations from the NCUA is updated to 2017 Q4.
- HUD Income Limits, including Median Family Income estimates, are updated to 2018.
- SNAP retail locations from the USDA are updated to 2018.