
OFN’s Coverage Map Shows $27 Billion in Community Lending
Community Development Financial Institutions (CDFIs) are mission-driven financial institutions that provide credit to entities in low-income areas. These areas are often considered too risky to lend to by mainstream financial institutions, or fertile ground for predatory loans by less savory entities. CDFIs work to identify projects in these areas that will make a positive impact.
(PolicyMap was originally created by the CDFI Reinvestment Fund to share their expertise with data and mapping.)
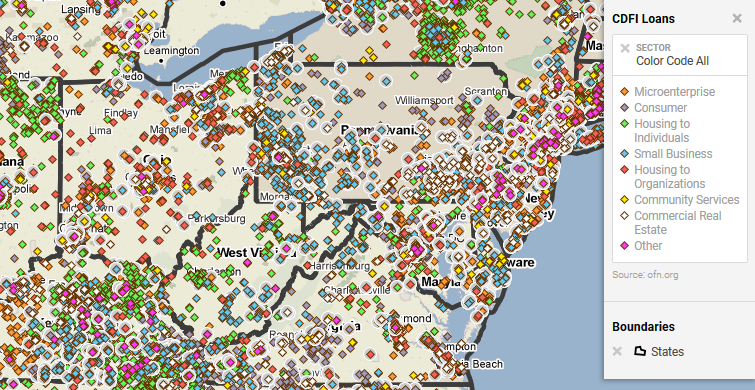
Opportunity Finance Network (OFN), a national organization of CDFIs, wanted a platform to share the impact of their members’ loans, and identify areas currently underserved by CDFIs. Using PolicyMap, they created a widget that shows the locations of their members’ loans, along with their amounts and what sector they’re in (like small business, housing, etc.).
The CDFI Coverage Map shows points for more than 270,000 loans, representing $27.6 billion in financing by 217 certified CDFIs. It’s being used by elected officials, investors, and others to see the scope of the CDFI industry.
OFN is getting ready to post research briefs using data from the Coverage Map. They’re already using the map to show that on a per capita basis, rural areas receive up to 10 times as much CDFI lending as large metro areas, which might be surprising for those that associate CDFIs with cities.
We’re looking forward to seeing what other conclusions they’ve reached!