
Watershed Boundaries
Data
Watersheds
Source
U.S. Department of Agriculture
Find on PolicyMap
- Map Boundaries
- Map Features
- Watershed Basins
- Watersheds
- Subatersheds
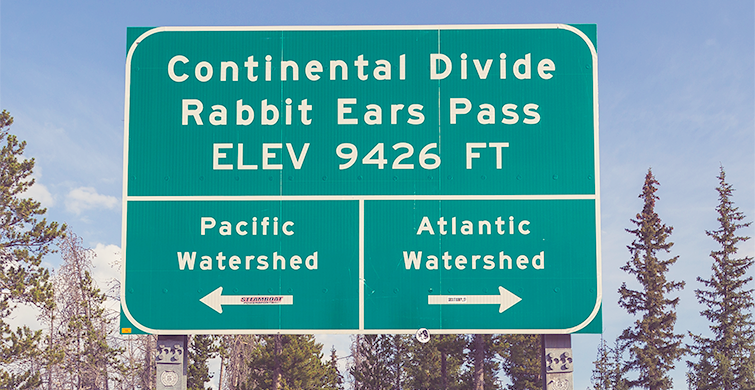
We spend a lot of effort working with administrative and statistical boundaries of all sorts: states, counties, ZIP codes, the list goes on. Lines drawn by people. But we recently added a new type of boundary determined entirely by nature: watersheds.
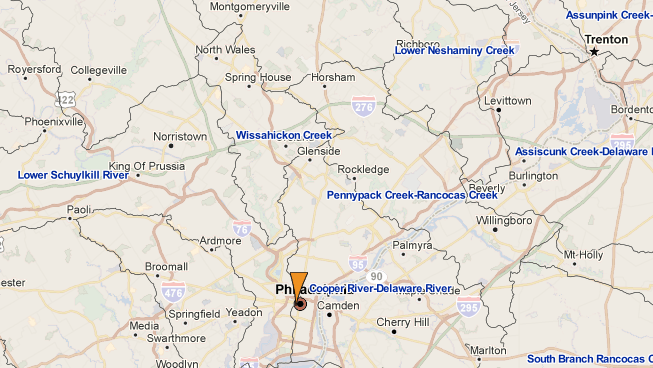
Watersheds are the naturally occurring boundaries that determine into which streams, rivers, and oceans water naturally flows. So, for example, if I were to pour a glass of water out my office window right now, that water would soon find its way into the Delaware River. My apartment, six blocks away, is in the Lower Schuylkill River watershed, so if I accidentally spilled a blueberry smoothie on the sidewalk there, it would flow to the Schuylkill River.
These boundaries are of particular concern to environmental planners, but affect not only river ecology, but also the global climate, public health, and more. For example, hydraulic fracturing (commonly known as “fracking”) is not permitted in the Delaware River watershed. (The ban is currently temporary, but a permanent one is being considered.) Despite the potential shale reserves, regulators have said that the risks associated with fracking affecting the ecology and water quality downstream are too great.
Looking at a map of watershed basins and jobs in oil and gas extraction, you can see that drilling activity in northern Pennsylvania abruptly stops at the Delaware watershed border:
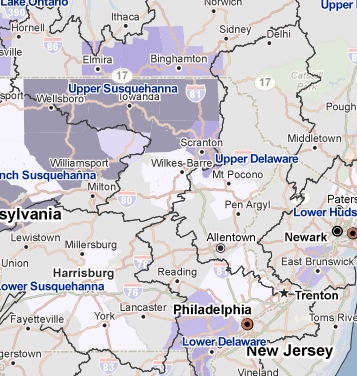
The Susquehanna River watershed basin, by contrast, has extensive oil and gas drilling, and has been declared one of the country’s most polluted rivers, for a variety of reasons including fracking. Baltimore, the largest city that draws water from the Susquehanna, only does so in times of extreme drought.
Because water tends to flow into a stream, which feeds another stream, which feeds a river, which runs into an ocean, there are multiple levels of watersheds. The USDA, which provides this data, provides six levels of hierarchy, from Region (e.g. “Lower Colorado Region”), to Basin (“Lower Gila”), to Watershed (“Middle Pinal Creek”). Each of these is smaller and more specific than the previous.
On PolicyMap, we’ve made three of these available: Basin, Watershed, and Subwatershed. Subwatershed is the smallest available hydrological unit.
These boundaries, which come from the U.S. Department of Agriculture, are available for all users, and is available in the Map Boundaries menu, under Map Features.