
Who’s Spending Too Much on Not Enough Food?

Data
Consumer Spending Habits
Source
PolicyMap, Quantitative Innovations (QI), BLS, and Census
Find on PolicyMap
- Incomes & Spending
- Spending and Affordability
- Consumer Spending Habits
- Spending and Affordability
Editor’s Note (06/30/2022): The PolicyMap team has updated the article below to reflect the 2020 update of Consumer Spending Habits data. These layers show estimated dollar amounts spent on housing, food, and more. This data is updated yearly and is available to premium subscribers.]
Food insecurity is a major public health concern because it contributes to poor health outcomes. When families can’t afford food, they eat less and they eat worse. And as inflation rises and food costs continue to spike in 2022, consumers are changing their shopping and eating habits.
Studies have shown that lower-income neighborhoods are less likely to have easy access to full-service supermarkets, and that food prices tend to be higher at smaller limited service markets and corner stores. This means that a low-income family may end up spending more for a gallon of milk than a higher income family. The same family would also have less money available to spend overall, which means that they would spend a higher proportion of their income on food. When unexpected expenses arise, such as medical costs or an unusually high utility bill, many families have to make tough choices and may have to go without healthier foods in order to make ends meet.
Healthcare practitioners want patients to eat a wide variety of healthy fresh foods, but those foods can be prohibitively expensive, or even unavailable locally. Many hospitals have addressed this problem by partnering with food pantries, or by opening food pantries themselves. Boston Medical Center, for example, opened a food pantry nearly 20 years ago, which allows physicians to “prescribe” healthy foods to patients.
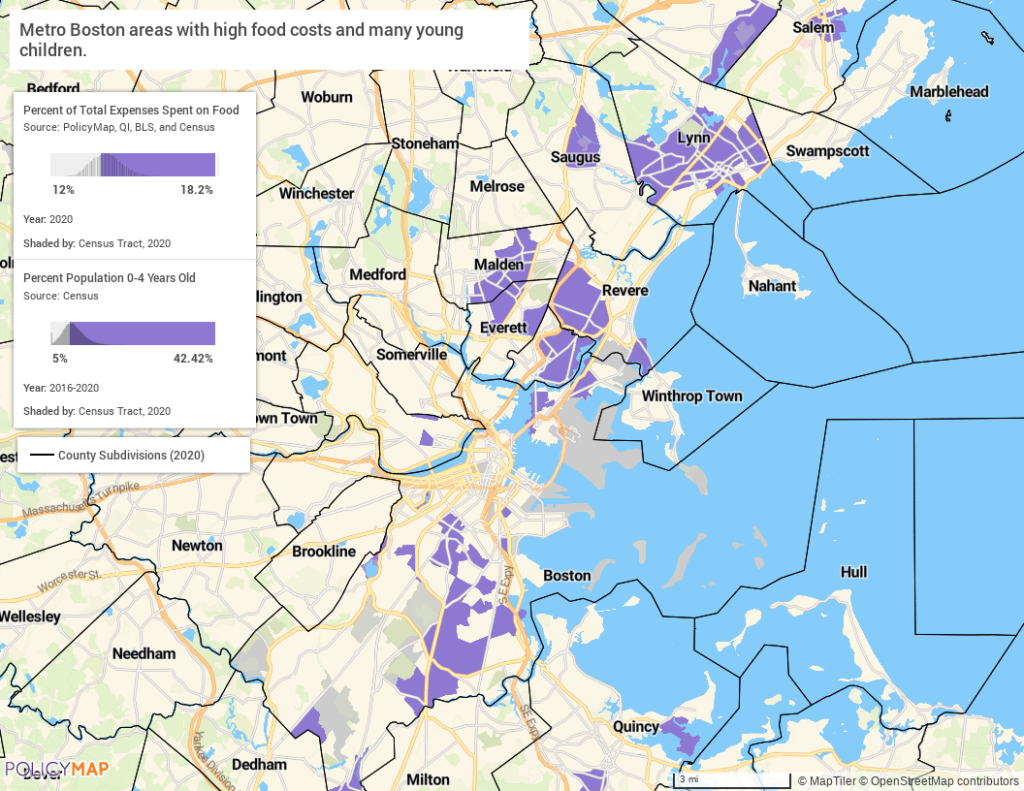
The map below shows areas in the Massachusetts cities of Boston, Chelsea, and Somerville—areas near Boston Medical Center that may be served by their food pantry program—with a relatively high proportion of children too young to have access to free school lunch programs, and where residents are estimated to spend a relatively high proportion of their incomes on food.
How can healthcare institutions like hospitals know where such services are needed? How can they find the specific neighborhoods where households are spending a high proportion of their incomes on food?
One tool is PolicyMap’s new Consumer Spending Habits data.
About the data
How much are people spending on different things? What neighborhoods are spending the most on housing? Where are people eating at restaurants the most? Where are families spending on education? Where are people buying alcohol?
New Consumer Spending Habits data developed by PolicyMap allows users to conduct basic market analyses on several categories of spending, including housing, food (which is subdivided into food at home and food away from home), alcohol, and education.
This includes three types of estimates at the census tract level (and higher): annual household spending as an average dollar amount (how much does the average household spend on this?), annual household spending on a category of goods as a percent of total spending (of the money that a household spends, what percent is spent on this?), and aggregate spending (how much does the neighborhood spend on this?). The percentage indicators allow users to find areas where people are particularly burdened by necessary household expenses. The aggregate spending indicators flag areas that might have a greater demand for certain categories of goods.
PolicyMap partnered with Quantitative Innovations, a data strategy and applied analytics advisory firm, to create this data. The estimates were developed by combining information on household spending patterns from the Bureau of Labor Statistics’ Consumer Expenditure Survey, which shows national trends of spending habits for different types of people, with demographic and economic information from the Census’s American Community Survey, which has local details on where different types of people live. It’s important to keep in mind that these are estimates, showing the spending habits that match the population of an area. They don’t show unusual spending habits that may be unique to a given neighborhood, and therefore shouldn’t be used to measure the efficacy of local programs.
This exclusive PolicyMap data is available to premium and enterprise license subscribers, and can be found in the “Incomes and Spending” menu.
UPDATE (01/25/2019): Just after we wrote this post, the Children’s Hospital of Pennsylvania announced the opening of a “Food Pharmacy”, a food bank available to patients who are identified as being food-insecure.