
Improved Home Sale Data: Because Not Everyone Lives in a Single-Family Home

Data
Home Sale Data
Source
Find on PolicyMap
- Housing
- Home Sales
- Sales and Sales Price
- All Homes
- Single Family Homes
- Condominiums and Cooperative Housing
- Two to Four Unit Multifamily
- Sales and Sales Price
- Home Sales
Update (06/09/2021): PolicyMap now has home sale data from Moody’s Analytics. Read more here.
Residential real estate trends matter to households and policymakers across the U.S. Since home purchases are often one of the largest investments a family will make, higher housing prices benefit homeowners, increasing the value of their investments and helping supplement retirement savings and providing equity for other life events.
On the other hand, high housing costs limit people’s access to enter the housing market, putting a strain on younger and lower-income families, who are shut out of the opportunities that home ownership provides. Moreover, rising home prices keep households renting longer, which puts more demand on rental markets and drives up rents, forcing lower income people out of established neighborhoods.
Understanding trends in residential housing markets can help identify which neighborhoods may require additional services and where affordability issues may arise. Unfortunately, there’s often an obstacle to following these trends. Though many cities have dense urban centers with a variety of housing types, traditional home sale data primarily focuses only on single-family homes, skewing the data.
The good news: We’ve addressed this issue in the latest version of PolicyMap’s home sale data.
Investigating Housing in NYC
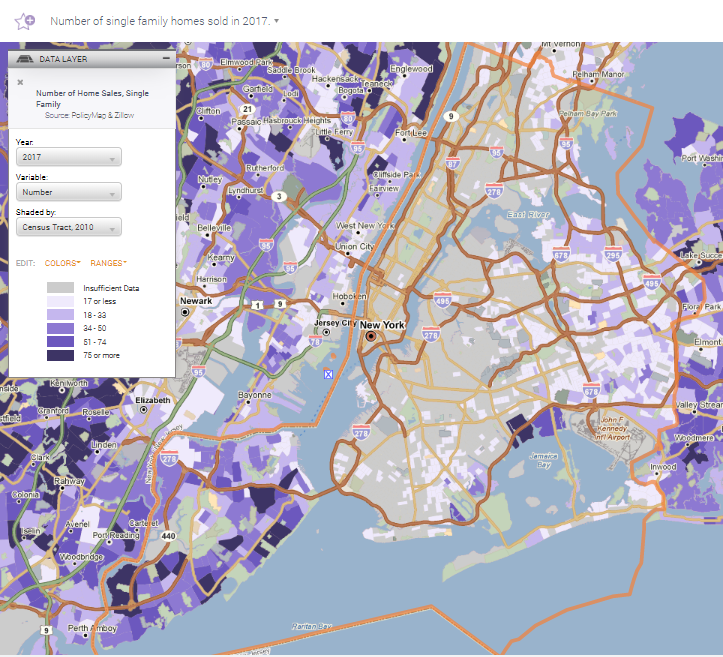
A map of single-family home sales in New York City shows large portions of the city with no sales at all. In the biggest city in the country, this certainly doesn’t mean there’s a stagnant real estate market. But if you equated single-family home sales with home sales in general, that’s what the data would lead you to believe.
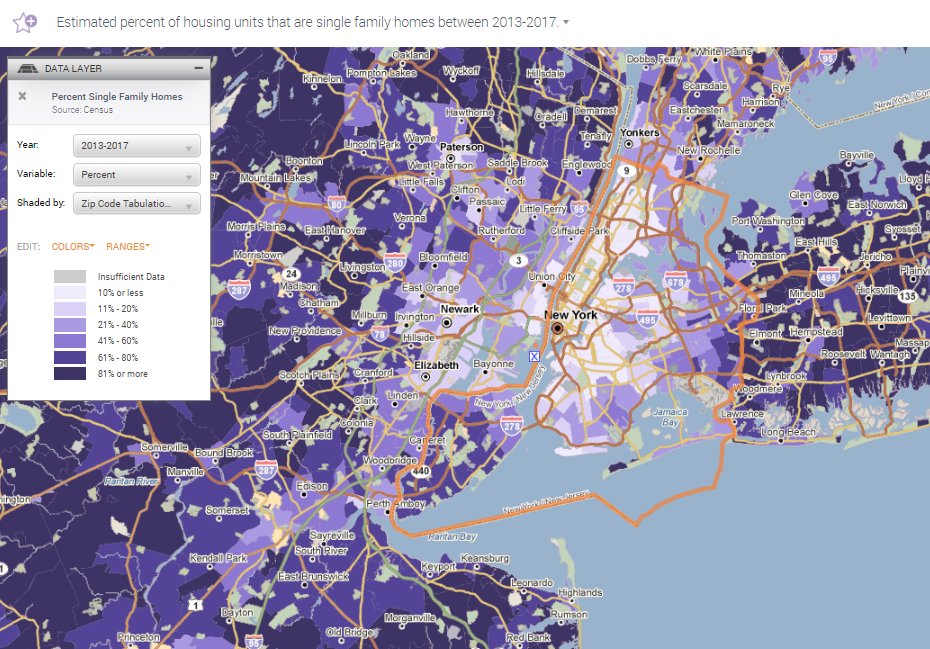
Being in the densest metro area in the US, New York City has few single-family residences, with most census tracts in the city having less than ten percent of their housing stock comprised of single-family dwellings.
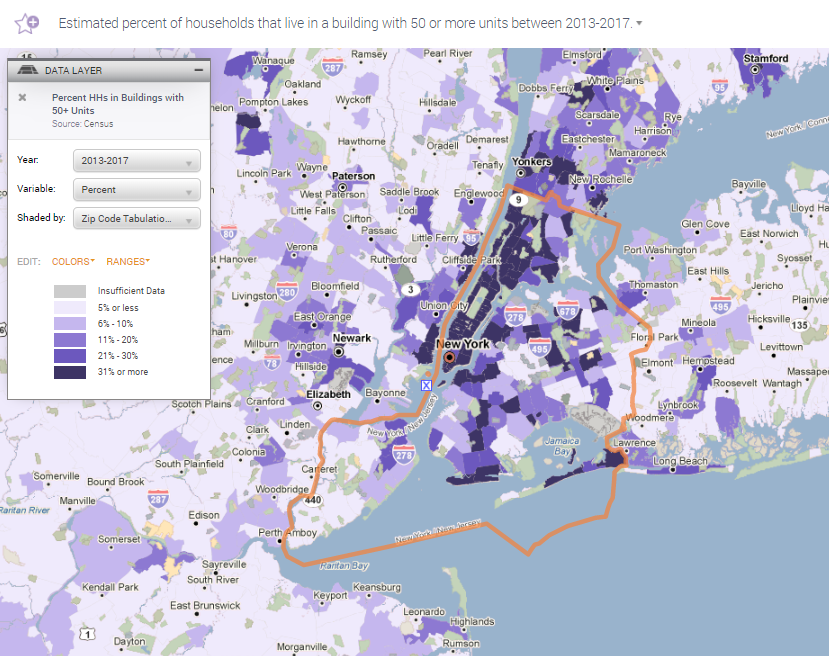
 Instead, much of the city – Manhattan in particular – is comprised primarily of multi-unit dwellings, generally larger than 50 units. So typical single-family home sale data is of little use.
Home sale data of large multi-unit buildings presents its own difficulties. The sale of a property with five or more units is considered a commercial property sale, not residential, and therefore isn’t included in residential home sale data.
Single condominiums and two to four unit multifamily dwellings, on the other hand, can be owner occupied and purchases of them offer an alternative look into the residential home real estate market. In a city like New York, where 67% of households rent their homes, this doesn’t tell the whole story, but it still provides good insights, without the complications of looking at commercial property sales.
Improved Data
To help address these urban real estate nuances, we re-analyzed our home sale data, developed by the PolicyMap data team using Zillow’s ZTRAX database. In a departure from traditional home sale data, in this new release we differentiate between residential household types, including data on single-family homes, two to four unit multifamily homes, and condominiums and cooperative housing.
We also updated our indicator of overall residential home sales to include all three of these housing types. Many areas of the country are dominated by single-family homes, and in these areas, the data will be mostly unchanged. In cities and densely populated areas, by broadening the definition to include all residential property sales, the data takes a more holistic view and includes any purchase that could be considered an owner-occupied property. Moreover, it aligns with FHA mortgage guidelines, allowing for easier comparison with home mortgage data.
In case you’re interested in the technical details, residential home purchases typically include single-family residences (SFR), two to four unit buildings, townhouses/row houses, rural residences, bungalows, modular housing, single-unit sales for condominiums, cluster homes, zero-lot-line homes, patio homes, garden homes, landominiums, and other forms of cooperative housing. They do not include sales of mobile homes, Planned Unit Developments (PUDs), apartment buildings, or multifamily housing with five or more units. Only arm’s-length transactions are included.
Residential Housing Market around New York City
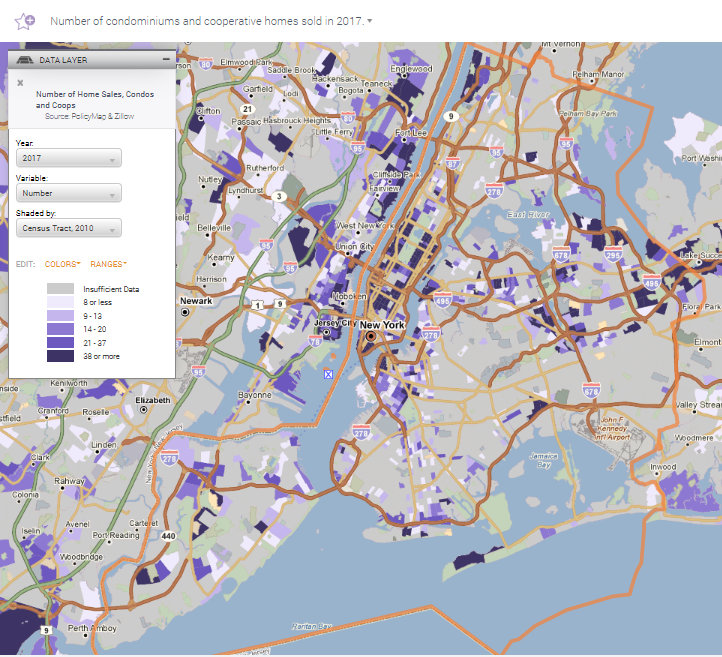
Manhattan, characteristic with its skyscrapers and doorman buildings, stands out as having a high concentration of sales of condominiums and cooperative housing units (co-ops). The neighborhoods just across the Hudson River in Jersey City and across the East River in Green Point, Williamsburg, and Brooklyn Heights share a similar tall-building density with Manhattan and likewise have a high volume of condo and co-op sales. There are also pockets of concentrated condominiums and co-op sales around Flushing, Queens. These concentrations align with subway lines and zoning for higher housing density.
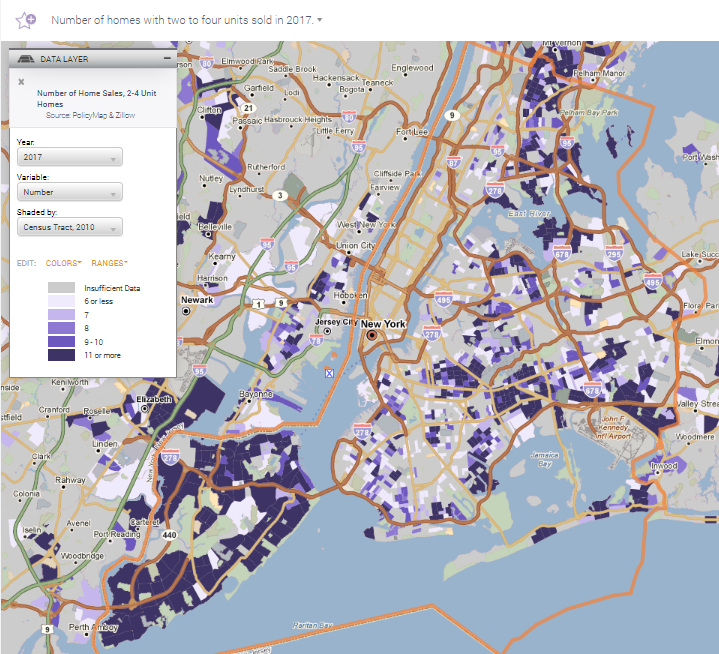
By contrast, sales of two to four unit properties are most prominent in Staten Island, the Bronx, and toward the center and eastern edges of Brooklyn and Queens.
And single-family homes are heavily represented in Staten Island and along the eastern edge of Queens and are least likely to be near public transit routes.
One of the key benefits from our shift to Zillow as a source of home sale data is that it gave us more control over the data. When we analyzed the data and saw that it wasn’t telling the whole story in cities like New York, we were able to go ahead and make these changes to make the data even more useful for everybody.
PolicyMap home sale data is available to subscribers and can be found in the Housing menu.
Photo credit: Alex Maisuradze