
New and Improved Ways to Tell Your Story with PolicyMap
The New PolicyMap is coming soon, bringing more ways to dig deeper into data on your communities. Not only will it will be easier than ever to use our maps to tell your story, but you’ll be able to expand your analysis with more powerful (but still easy to use) tools. Okay, lean in. Here’s the run down.
Find the Data You Need: We are introducing an improved menu for our data that makes it easier to navigate our ever-growing library of data. And, when you don’t have time for exploration, we have a data search bar at the top of the map. It’s easy to use, searches the entire library, and gets you exactly what you need.
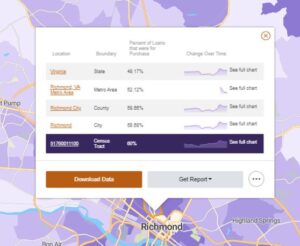 Quickly Understand the Data on the Map: Because we’re completely rebuilding the underlying PolicyMap platform, you’ll find additional tools that allow you to quickly understand data on your map. You will be able to simply hover over the map to see the data values of a place, and click to put them in context: how does a place compare to its region? How has it changed over time? You will also be able to pull out values for unique geographies like congressional districts in one simple click from the map.
View More Granular Data: 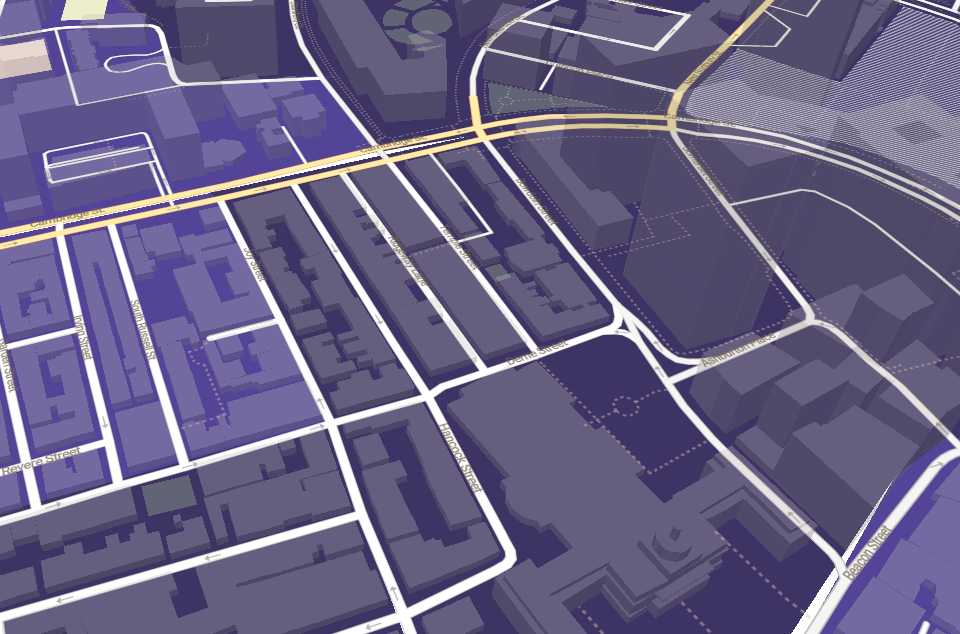 Your maps will now display at even closer zoom levels – 8 levels deeper than you can currently go with PolicyMap. It means you can zoom in to a parcel and get information about it. And, in the new 3D mode, you will see building outlines on top of the data.
Want to show granular data for a large area? You’ll be able to view smaller geography data at further out zoom levels. If you’re looking at a region, and want to see data shaded by block groups instead of zip codes, you can. This will be true as well for data that was previously limited to close zoom levels, like flood zones. You will no longer be limited to visualizing any information at only close-in zoom levels.
Customize Your Maps: You’ll find more ways to create the exact map you need for telling your story:
- Choose from 4 or 5 different base maps, like satellite and terrain views. The base maps will be updated frequently so you can see new roads or developments as they are built.
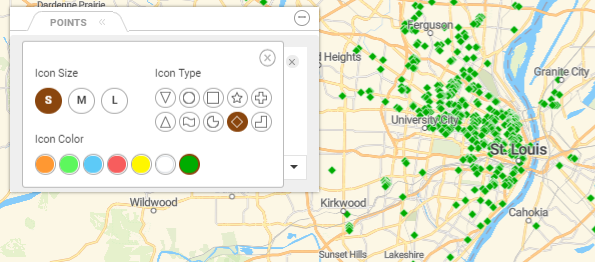
- When displaying point-level data, choose from a library of icons and colors, easily distinguishing hospitals from health centers, or schools from libraries.

- Customize your base map by turning on or off city names, road labels, parks, and other map options.
- Create custom regions using a more fluid interface. Edit custom regions you’ve already made. Select from a wide range of colors for shading your areas. Create and edit non-contiguous custom regions.
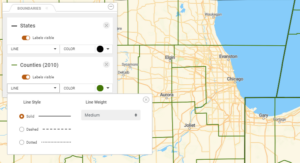
- When adding boundaries to your map, like zip codes or congressional districts, you will be able to pick the color and thickness of the boundary displayed on the map. Adding multiple boundaries and customizing each one will make it easier to understand the story you are telling with your map.

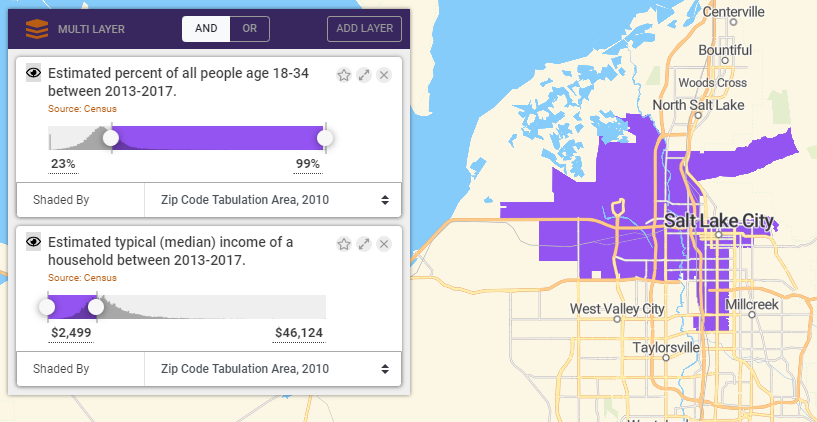
Conduct Deeper Analytics: You’ll be able to find areas that meet up to five criteria you set on a single map to see where to target your activity (that’s up from the three criteria currently available). Layer up to five datasets on map to see areas that meet all or any criteria you set. Visualize those areas at further out zoom levels. The kinds of zoom and display limitations we have with the current platform are done away with in the new PolicyMap. We are also introducing a new histogram so you can better understand where data falls among the ranges you’ve set on a map and enable you to more logically select cut points for your analysis.
No Need to Learn a New Interface: For those of you who are long time PolicyMap users, no worries. The fundamental interface remains the same. We’ve consolidated a few items in the interface and made it easier to go into a multi-layer map mode, but you’ll find all the features in the places you’d expect. Also know that PolicyMap is now mobile-friendly, particularly with tablets.
Please reach out if you want to get a sneak peek or would like to participate in our user testing. We are excited to continue incorporating feedback from our users!