
The New PolicyMap: What’s New in this Release
The new PolicyMap (Beta) is full of new and improved features for gaining essential insights to help you solve the most critical problems facing your organization.
PolicyMap subscriptions now include:
- Simpler data menus
- Customizable trend charts
- Map legend improvements
- Detailed data in tabular form
- Quick download feature
- Closer zoom levels and building footprints
- Basemap options
- Icon and boundary weight customization
- Clip/mask tool
- Editable custom regions
- 5 Layer Maps: overlap or intersection
- Higher-resolution exports
Find the Data You Need: We’ve introduced an improved menu for our data that makes it easier to navigate our ever-growing library of data. If you don’t have time for exploration, we have a data search bar at the top of the map. It’s easy to use, searches the entire library, and gets you exactly what you need.
Gain Context: Because we’ve completely rebuilt the underlying PolicyMap platform, you’ll find additional tools that allow you to understand data on your map quickly.
- You can simply hover over the map to see the place’s data values and click on the map to put them in context: how does a place compare to its region? How has it changed over time?
- You can also pull out values for unique geographies like congressional districts in one simple click from the map.
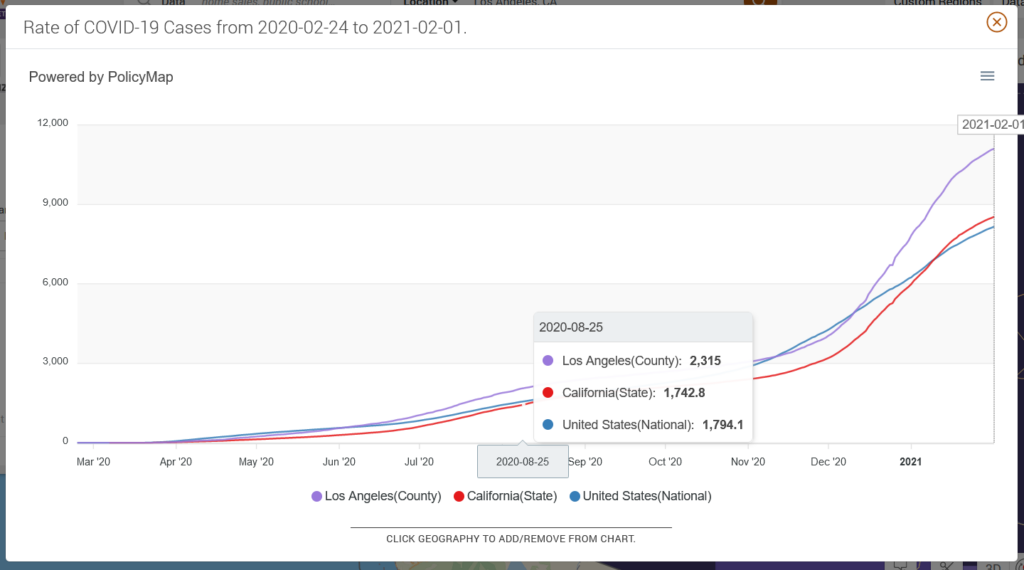
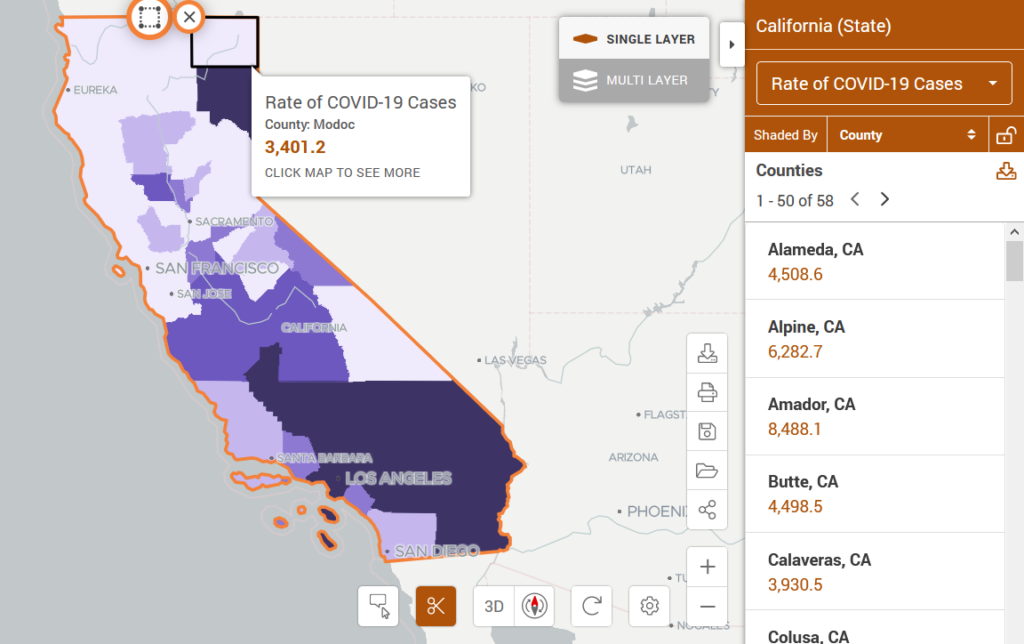
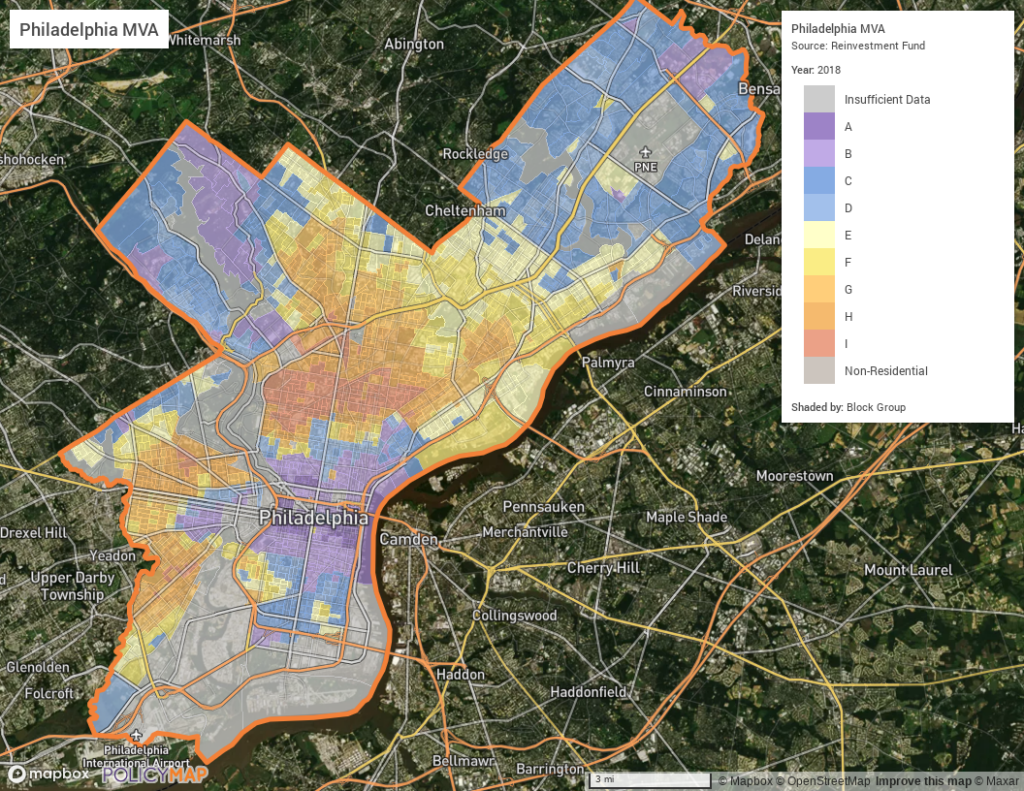
Display Data Your Way: The legend on the interactive map allows you to change the color of the map, as well as edit the ranges and geography for display. We’ve also introduced a new histogram so you can better understand where data falls among the ranges you’ve set on a map. This helps you to select cut points for your analysis more logically.
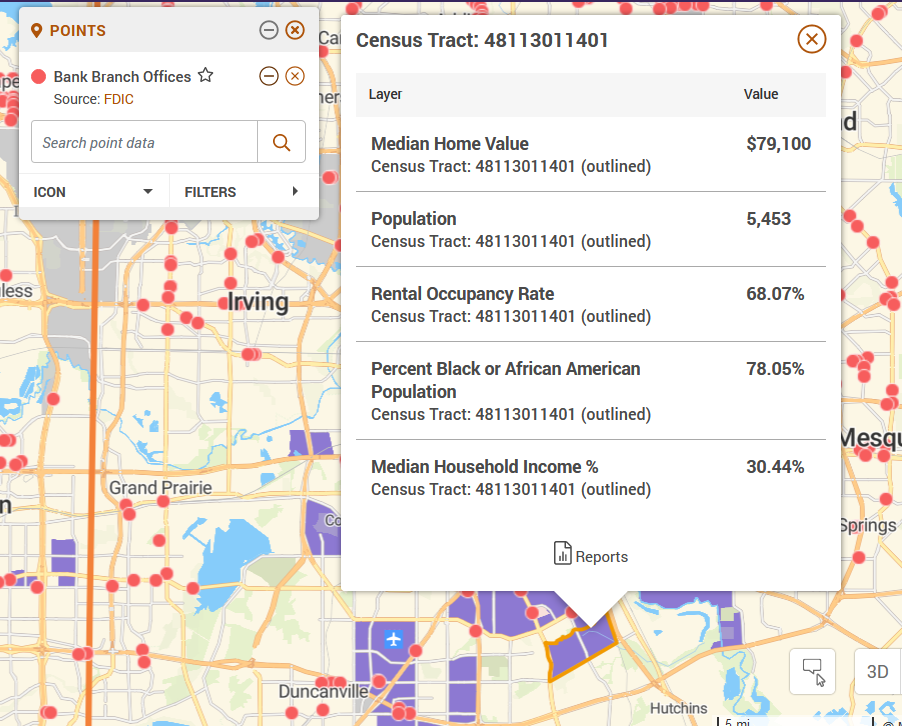
See Values for An Area with the New Sidebar: See all values or a list of points (address data) for a selected area by adding data (layer and/or points) to the map, selecting the city, zip code, or other areas of interest on the map, and clicking “Table” for layer data and “List” for points from within the info bubble to reveal the new Sidebar. The sidebar displays the data in tabular form.
Download Data: While our full download feature is under construction and not available in this Beta release, you can instantly download indicator values or a list of addresses for specific geography through the new Sidebar.
- Using the download icon in the Sidebar, instantly download the data to a simple CSV file.
- If you need the full download option, just toggle back to the legacy version of PolicyMap. The legacy version of PolicyMap will remain live until the last remaining features are released to the new PolicyMap.
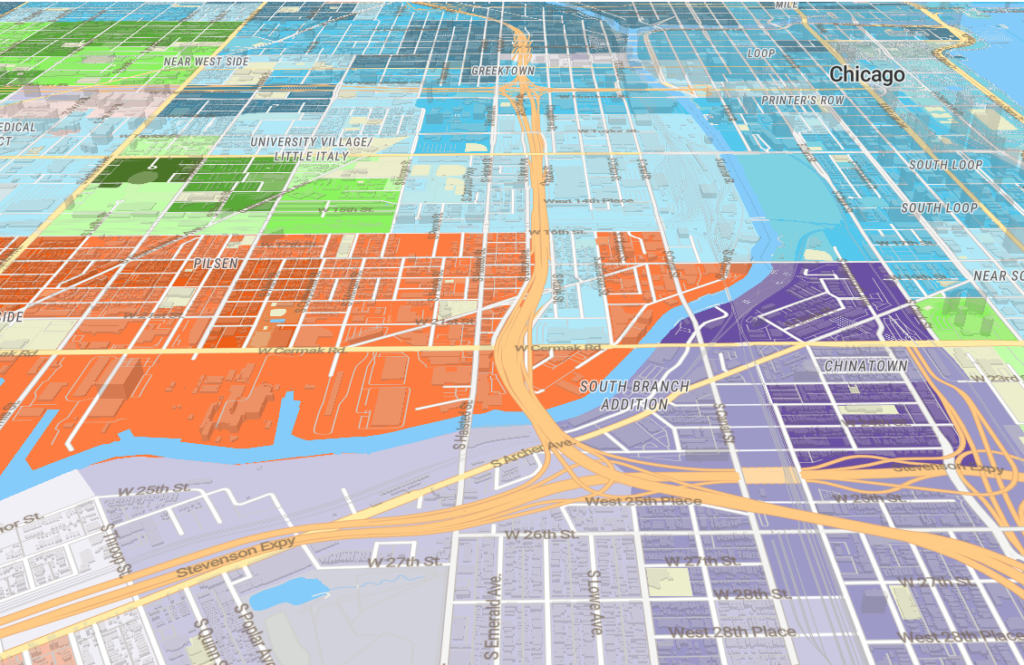
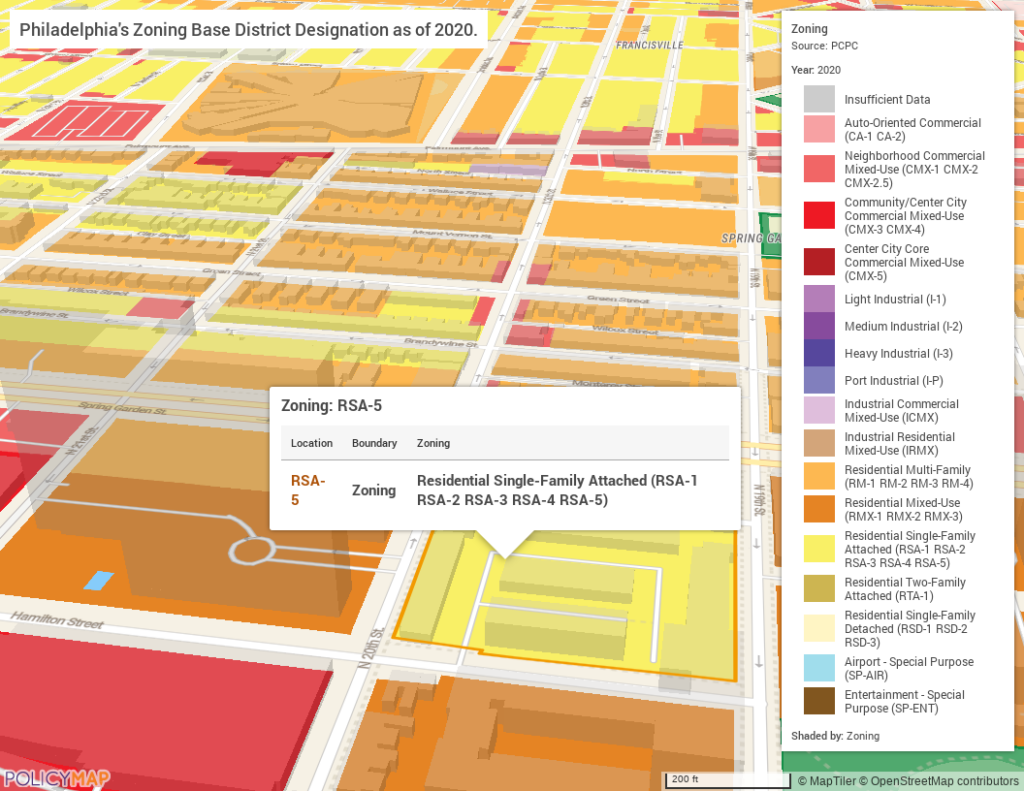
Really Dig In: Maps on PolicyMap can now zoom in an additional 8 levels, so you can really zoom in on an area to see address-level data, parcel shapes if available, and building footprints. Our new 3D mode allows you to see the building outlines on top of the data and tilt the map to the angle you prefer.
This comes with a significant update for PolicyMap users. If zoomed out to a region, for example, and want to see data shaded by block groups instead of zip codes, you can now do that. This is true as well for data that was previously limited to close zoom levels, like flood zones.
Customize Your Maps: You’ll find more ways to create the exact map you need for telling your story:
- Choose from four different base maps, including satellite and terrain views, layer thematic data, points, custom regions, and boundaries on top of any map in PolicyMap.
- Customize your base map by turning on or off city names, road labels, parks, and other map options.
- When displaying point-level data, choose from a library of icon shapes, sizes, and colors, easily distinguishing hospitals from health centers or schools from libraries.
- When adding boundaries to your maps, like zip codes or congressional districts, you will be able to pick the color and thickness of the boundary displayed on the map. Adding multiple boundaries and customizing each one will make it easier to understand the story you are telling with your map.
- Only want to see the data for a specific geography or custom region shaded on the map? Select the scissor icon in the bottom right of the map. For now, it cuts out layer data – coming soon will be the ability to cut out points and boundaries outside of the area as well. You can clip for any standard geography or custom region, and it will carry over to the print as well.
Custom Regions for Targeting Specific Areas: The new custom region feature uses a more fluid interface. You can also edit custom regions you’ve already made and create and edit non-contiguous custom regions. Select from a wide range of colors for shading your areas.
Conduct Deeper Analysis: You’ll be able to find areas that meet up to five criteria you set on a single map to see where to target your activity (that’s up from the three criteria currently available) using Multi-Layer Maps. You can also layer up to five datasets on a map to see areas that meet all or any criteria you set.
Embed Interactive Maps: You can now create highly interactive maps for your website on your own. Embedded maps can contain any non-proprietary data in PolicyMap or data we have loaded for you. Changed the map colors and icons? Changed the base map? Yes, these will carry over to your embedded map.
Print your Work as a PDF or PNG File: You can now create png files and PDFs with a significantly higher resolution for incorporation in your work. The print preview window allows you to adjust your zoom level and location. Everything on the map carries over to the print.
While incorporating these new features, we ensured that the interface feels as similar as possible to the current PolicyMap. You’ll generally find things where they were before or in a logical place.
The release of our Beta version is only the first step. Over the coming months, we will be rolling out the remaining key functions and iterating on what we’ve done to date. And, we need your feedback to drive that iteration. This is your tool; please reach out and tell us what you’d like to see us do.
One last note: Although it’s full of new features, the Beta site does not yet support full data downloads, uploads, or saving of your work. Fear not. If you need any of those to do your work now, just toggle back to the legacy PolicyMap. We will be keeping both the old and new platforms live while we finish up those remaining features.
Subscribe to get all these features and more!