
Dig Deeper into Housing Market Trends using Home Sale data from Moody’s Analytics

Data
Moody’s Analytics: Home Sales
Source
Moody’s Analytics
Find on PolicyMap
- Housing
- Home Sales
- Annual & Quarterly
- Home Sales
[UPDATE 05/17/2022: PolicyMap now sources home sale data from another leading data provider.]
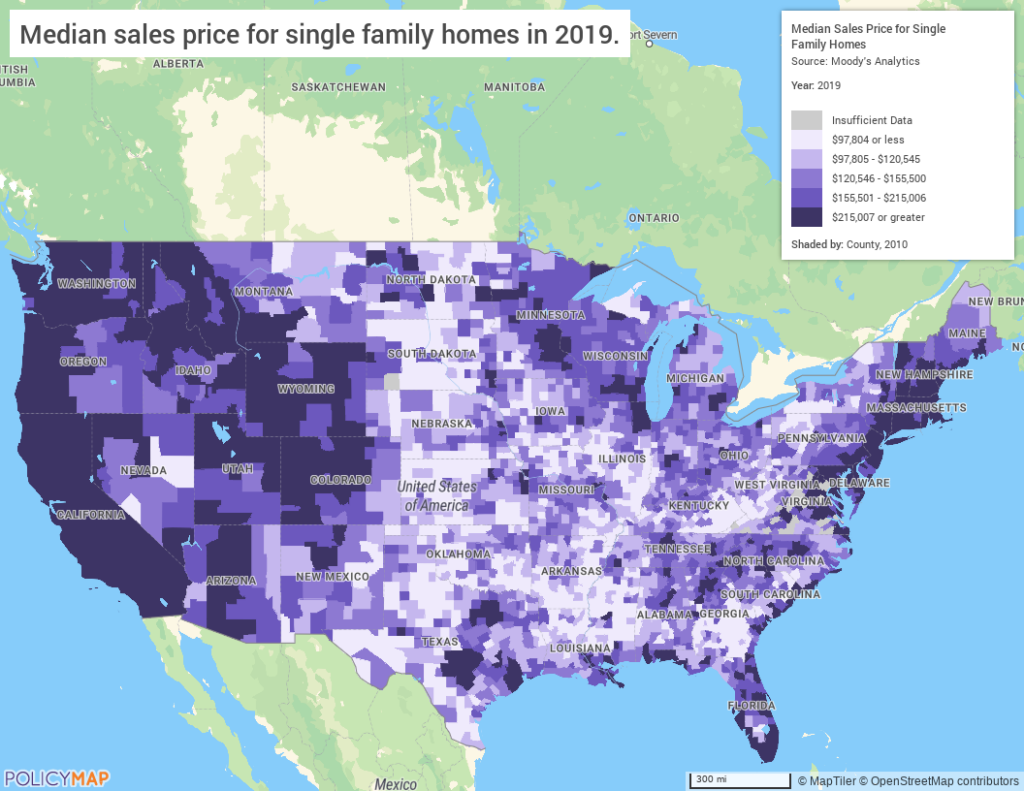
High-quality and affordable housing is critical to a family’s wellbeing. But homes in some areas are so expensive that many families struggle to meet this fundamental need. Housing prices can change significantly over time with market conditions and vary drastically across the country. PolicyMap Premium subscribers and Enterprise License users can now access data from Moody’s Analytics on single-family housing sales that show variations in home sale prices and volume of home sales across both time and space.
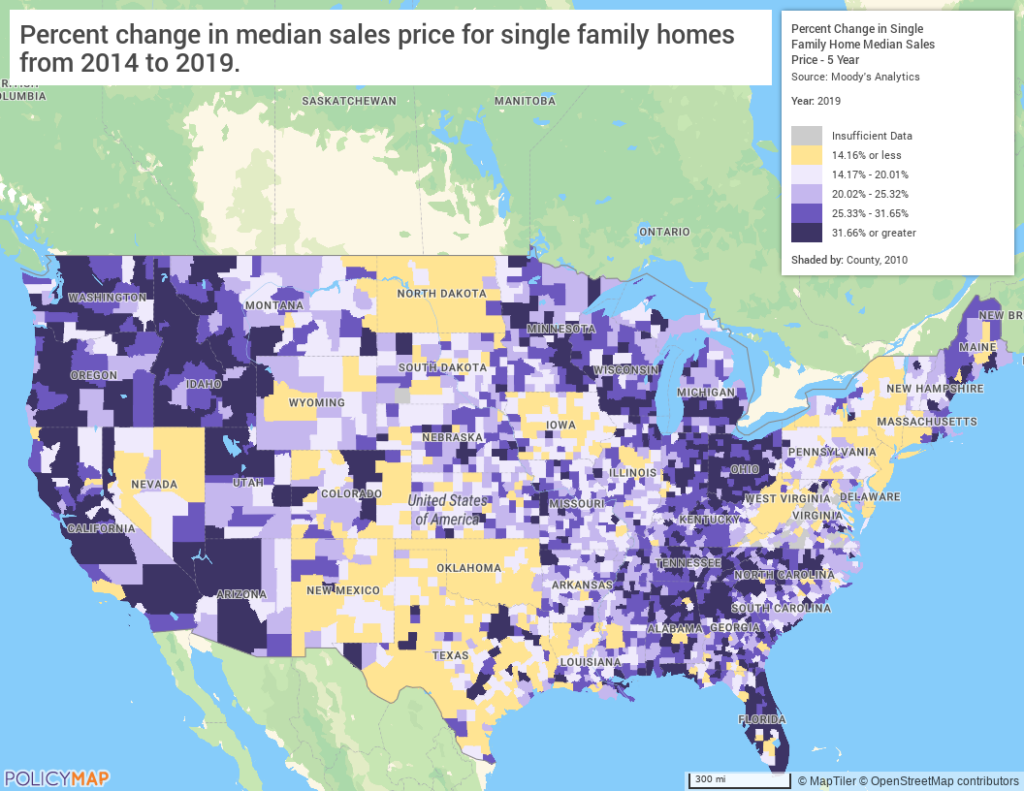
Mapping percent change in median sales price over the past five years shows how different housing markets can be, particularly in the 2008 housing market crash and subsequent recovery. The darker purple colors on this map indicate that housing prices have risen the most in Northern New England, the Midwest, the Southeast, and the west coast. Areas in yellow are where housing prices have not risen as steeply.
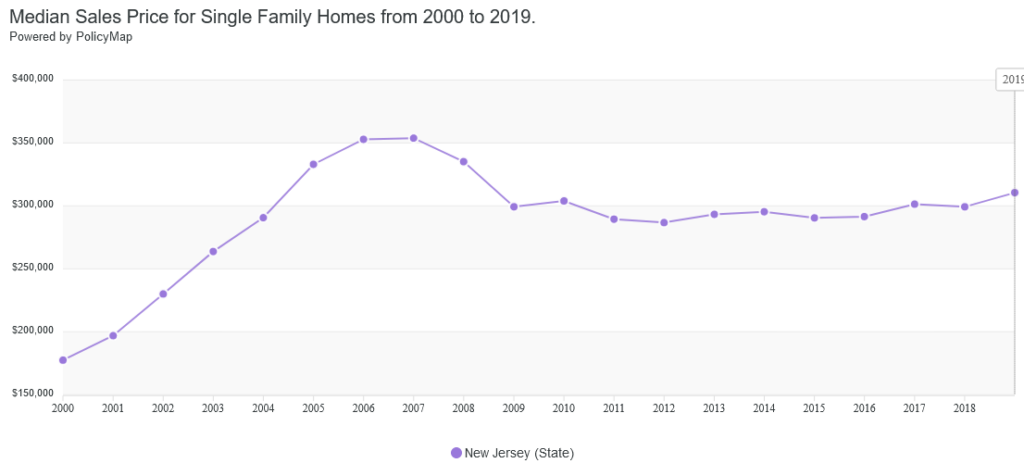
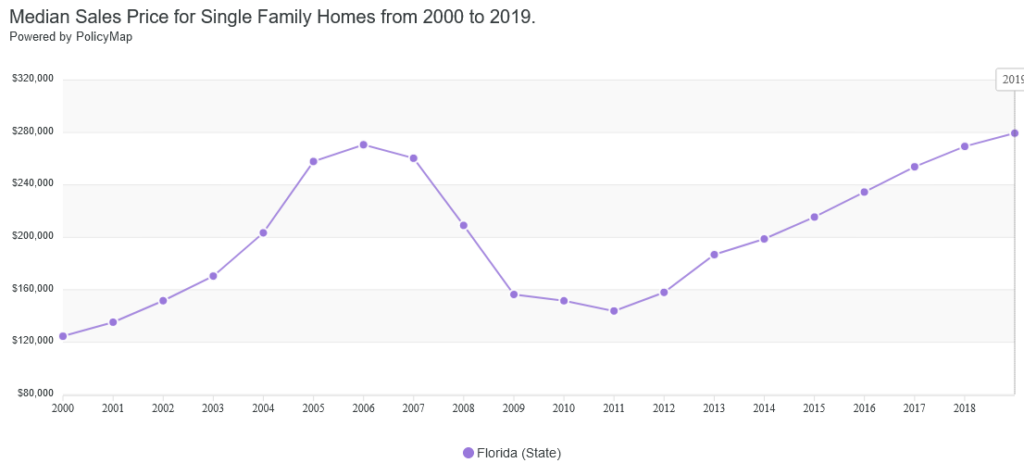
Looking at the change in housing prices over time shows that areas with a less steep increase in housing prices are not necessarily those that have not recovered from the 2008 crash. For example, comparing percent change in New Jersey with Florida might initially seem that New Jersey’s housing market may not have fully recovered from the 2008 crash, while Florida’s has. However, comparing the trend lines below shows that New Jersey’s housing prices have risen less steeply because they were not hit as hard by the crash in the first place.
Using data to understand these variations in the housing market may help anticipate the next market downturn, a particular concern with the recent pandemic-driven changes in the housing market.
More Housing Data Now on PolicyMap
PolicyMap has also added a Property Tax section to the Housing menu to help users assess this important contributor to housing costs. In addition to mapping Median Real Estate Taxes from the American Community Survey, PolicyMap calculated two additional indicators to help users contextualize property tax costs—Property Tax as a Percent of Home Value, and Property Tax as a Percent of Income. Data from the IRS on real estate taxes reported on income tax returns provides another view of property tax costs.
Users can also now access percent change of the Federal Housing Finance Agency’s Housing Price Index on the Housing menu. This indicator provides another measure to help users assess changes in the housing market over time.
About the Data
Home Sales
The home sales data shows number of sales and median sales prices of existing single-family homes for states and counties. These estimates are available by year and by quarter and will be updated on PolicyMap each quarter.
Moody’s Analytics estimates number of sales of existing single-family homes for U.S. States and counties based on loan-level data from a premier provider, the U.S. Bureau of the Census (BOC), and the National Association of Realtors (NAR). The underlying loan-level data is collected from deed transaction filings from county recorders offices’ public-record filings.
Data on median sales prices of existing single-family homes is estimated by Moody’s Analytics using data from the National Association of Realtors (NAR), the Federal Housing Finance Agency (FHFA), the U.S. Census Bureau, transaction-level data from a premier provider, other statistical agencies and other local associations of realtors.
Property Tax
Median Real Estate Tax indicators are from the American Community Survey conducted by the U.S. Census Bureau. These values include real estate taxes, special assessments, school taxes, county taxes, and more. PolicyMap used additional data on income and housing values for the percentage calculations.
The IRS also collects data on property taxes paid by those who itemize deductions for income taxes. More information on property tax deductions can be found here: https://www.irs.gov/taxtopics/tc503.
Housing Price Index
Percent change in the Housing Price Index provides a broad measure of the changes in single-family house prices over time. This index measures average price changes in repeat sales or refinancing on the same properties. This measure only includes properties with conventional mortgages held by Freddie Mac or Fannie Mae. For more information, visit https://www.fhfa.gov/DataTools/Downloads/Pages/House-Price-Index.aspx.