
Track Population Trends Using Census 2020 Data

Data
Census 2020 decennial data
Source
Census American Community Survey (ACS)
Find on PolicyMap
- Demographics
- Housing
For the first time in ten years, we have a count of the American population, revealing a highly dynamic populace that is moving, aging, and diversifying. PolicyMap provides all of our users with this invaluable information for neighborhoods, small towns, our biggest cities, and regions across the U.S.
We just added the Census 2020 data to PolicyMap. What does it tell us?
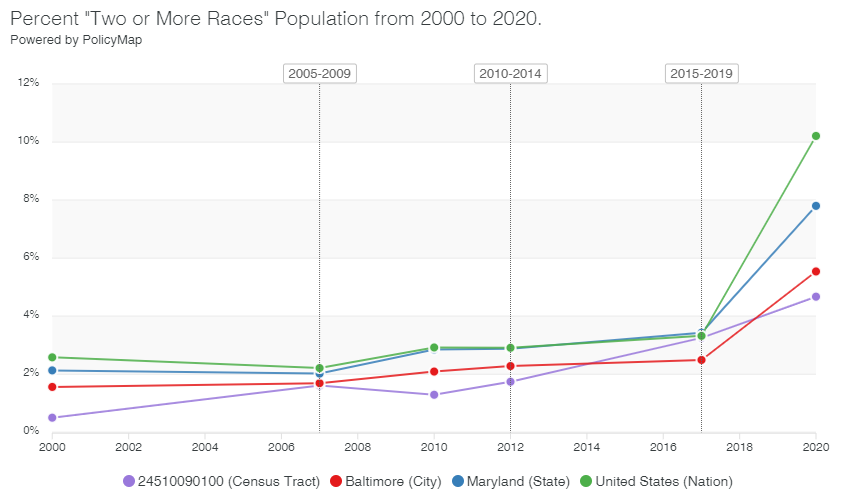
Race and Ethnicity
Americans are increasingly identifying as multi-racial, with the U.S. becoming more diverse than ever. The white population of the US declined for the first time in recorded history, and the multiracial population grew significantly, with the Asian population increasing, too, in 2020. Hispanics comprised around half of the population growth, with many of them identifying as multiracial rather than white. Those who identified as “Some Other Race” increased significantly, as well, surpassing those identifying as Black or African American. These shifts are likely due in part to improvements made to the design of the 2020 Census survey. But demographers believe that the 2020 Census numbers are not only a result of improvements made to the survey but are also a true reflection of the shifting composition of the country.
Age
The adult population in the U.S. grew by around 10%, and the count of children (under 18) declined. The decline in younger population is attributable to an overall drop in birth rates among Americans. These shifts may necessitate policy interventions to promote a balanced American economy with fewer dependents, fewer workers, and more older age adults.
Housing
Those living in urban areas have increased over the past ten years, with the majority of metro areas gaining population and rural areas losing residents. Housing unit counts increased by around 6%, but that, too, has slowed in the last decade compared to previous decades. College and university housing grew significantly (+10%) since 2010, indicating that student housing continues to be in demand.
How Can I Use New Census Data in My Work?
Track trends across time for all geographic levels, from neighborhood to metro area to state.
Search for locations with guidance about places that match (or don’t match) between the Censuses.

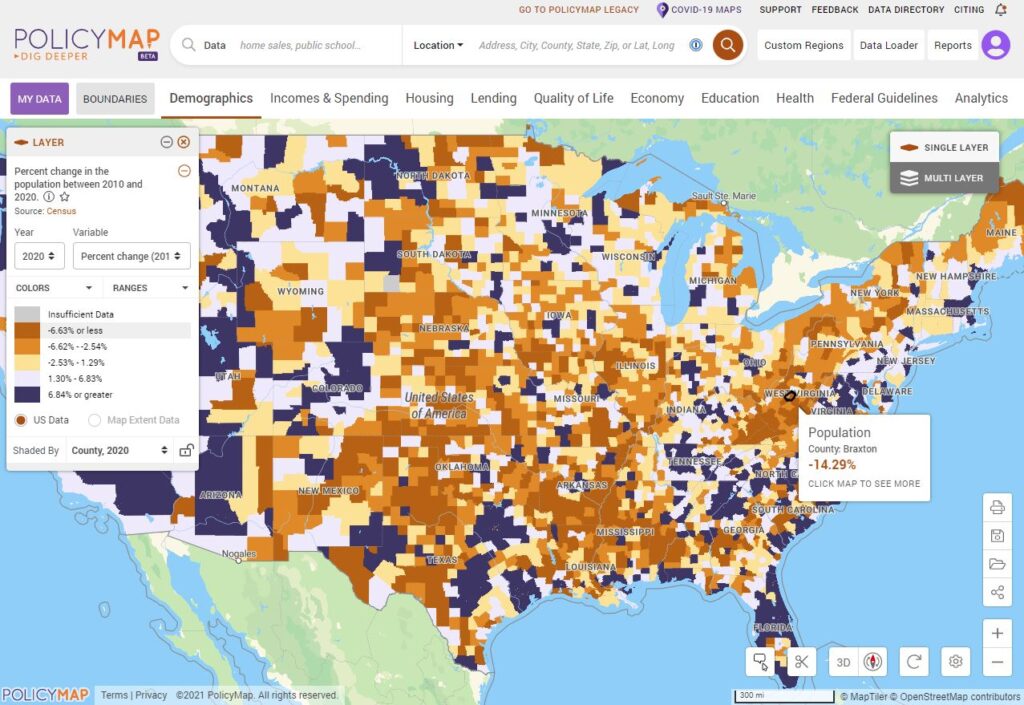
Visualize population changes on maps for communities across the U.S.
What Data Is Now on PolicyMap, and What’s to Come?
The Census data that’s available is a small set of indicators that will be expanded in the coming months. These new Census 2020 indicators include only the following variables: total population, race (including both the total count of each race category and the count of non-Hispanic people of each race category), group quarters, and total housing units. These variables come from the 2020 Census Redistricting Data (the Public Law 94-171) Summary File, the dataset that is currently available from the Census as of the writing of this blog. The Census will continue to release information such as the more complete Demographic and Housing Characteristics File (DHC), and 2020 geographic boundary guidance that we’ll incorporate into PolicyMap, allowing us to provide even more calculations for our users. For now, to easily compare stats across Decennial Censuses, we are displaying the 2020 data using PolicyMap-created boundary bridge tables that our team developed using spatial analysis of the various boundary vintages (2000, 2010 and 2020). And in January 2022 we’ll update the Census’ American Community Survey (ACS) data to 2016-2020, making the 2020-related data suite even more robust. At that time, we’ll update our Reports feature and our Custom Region builder to include 2020 boundaries and data.
Census 2020 Data Quality Questions
We’ve received questions from our users about data quality concerns with the Census 2020. In a forthcoming blog post, we will share what we know about the new methods applied to the Census 2020 that are aimed at protecting anonymity that are prompting these questions, and how they may affect the PolicyMap user experience. Until then, users can review the Census’ efforts to ensure data quality here.