
Lasting Effects of HOLC Lending Boundaries
Data
Mapping Inequality: Redlining in New Deal America
Source
University of Richmond, University of Maryland, Virginia Tech, and Johns Hopkins University
Find on PolicyMap
- Lending
- Historic Lending Boundaries
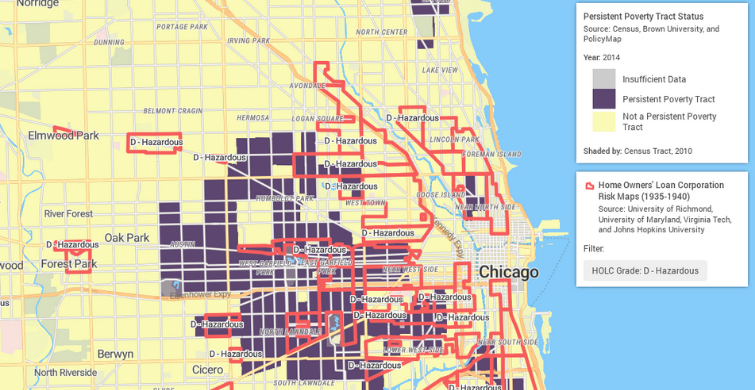
Historic lending practices had long-lasting effects on the equitability of homeownership in the United States. In the 1930s, the Home Owners Loan Corporation (HOLC) was created to relieve homeowners who could not pay their mortgages. The agency used government bonds to buy out mortgages from banks then worked with borrowers on refinancing at lower rates over more extended periods. The strategy allowed many families to stay in their homes during the worst of the great depression. However, by the late 1930s, the agency started creating “residential security maps” that outlined lenders’ common understandings of risky neighborhoods. Research has found that neighborhoods deemed “Hazardous,” a practice known as redlining, had higher interest rates than areas not considered hazardous. The maps’ effects still linger in many areas, preventing accessible homeownership.
The residential security maps from HOLC, digitized by the University of Richmond’s Digital Scholarship Lab as part of their Mapping Inequalities project, show the effects of mortgage lending, home value, and homeownership today. We can see this dynamic in the Twin Cities of Minneapolis and Saint Paul, MN.
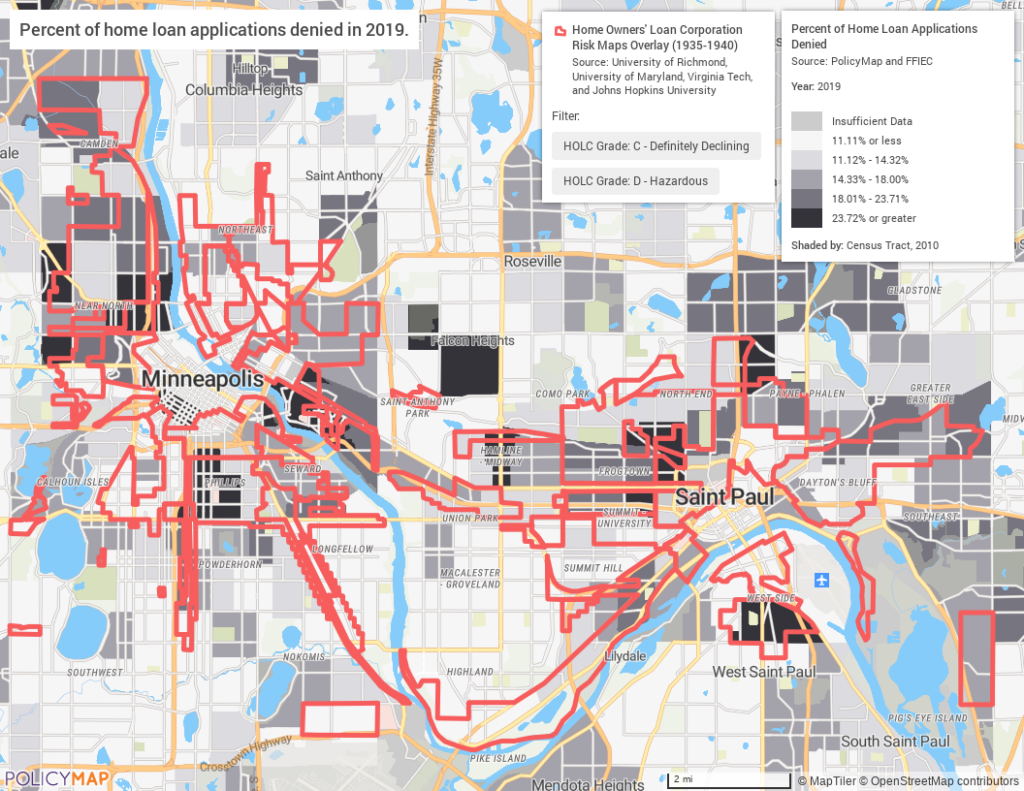
The map below shows the percent of home purchase loan applications denied in 2019 in the Twin Cities. We see that areas with the “Hazardous” grade have some of the darker census tracts, meaning they experienced a higher percentage of purchase loan denials.
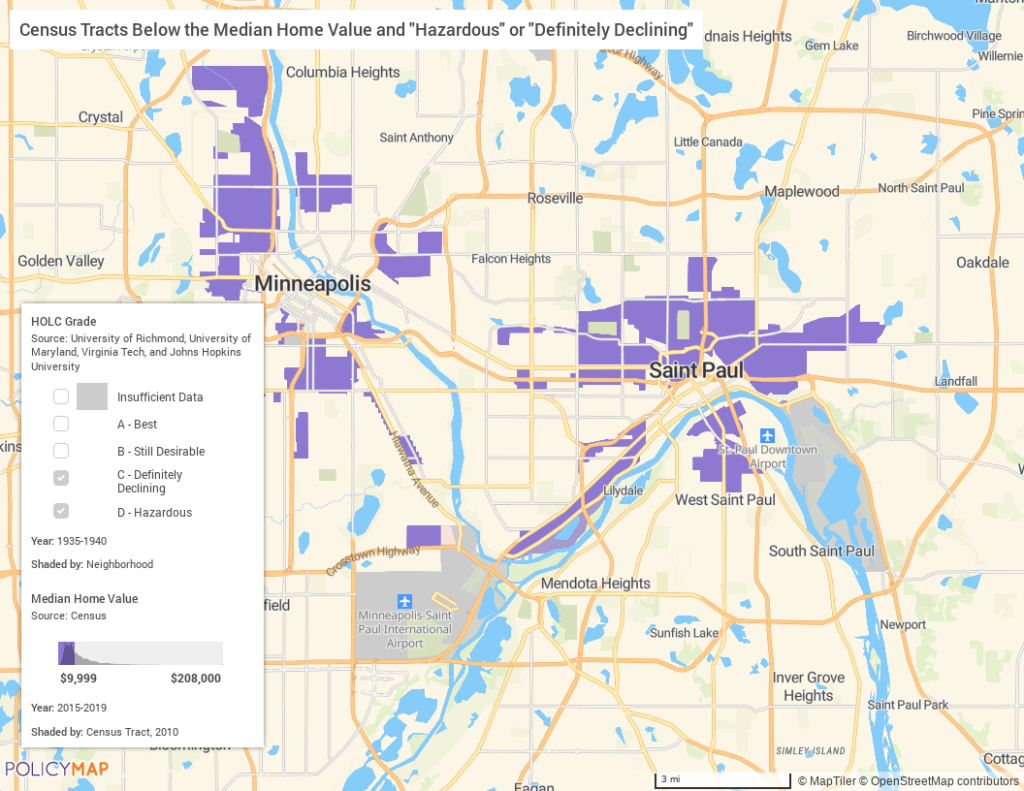
According to the 2015-2019 ACS, Minneapolis, MN had a median home value of $251,600, and Saint Paul, MN had a median value of $208,000. When we add median home value to the map, we see that areas deemed “Hazardous” or “Definitely Declining” are still below the most recent median home value estimate.
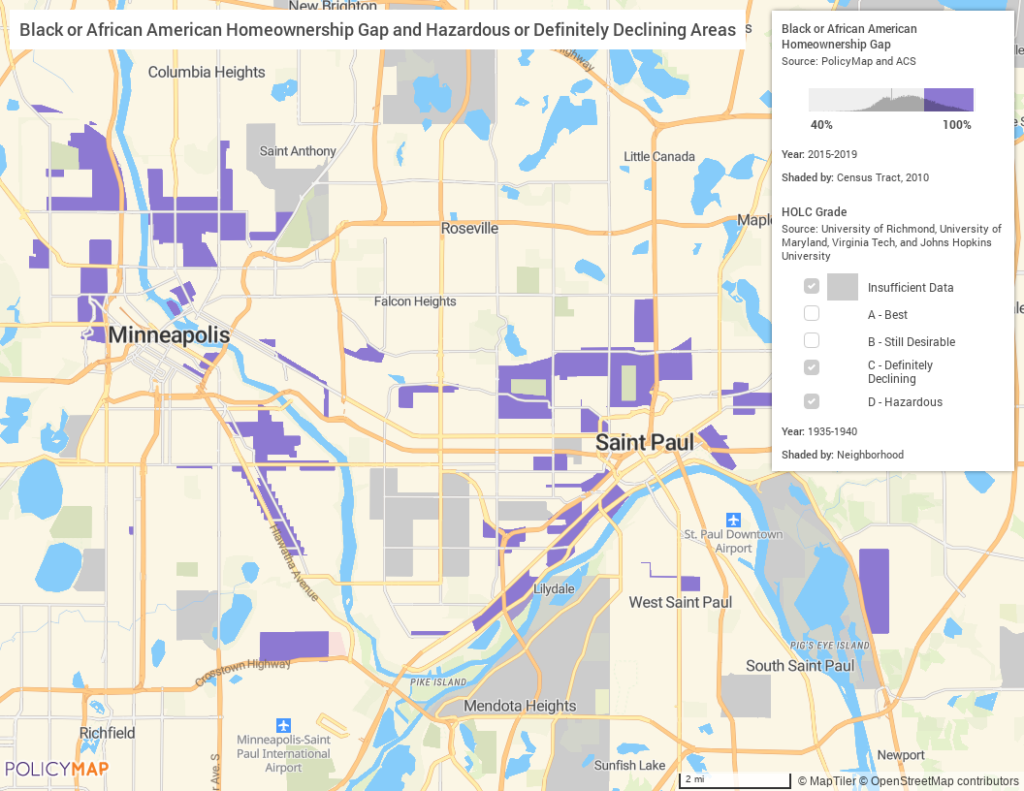
Research published in 2018 shows that Minneapolis, MN had one of the broadest homeownership gaps in the country. The map below shows areas where the homeownership gap is 40% or greater between Non-Hispanic whites and Black or African American and HOLC grades “Hazardous” or “Definitely Declining.” Areas highlighted on the map show how the racial homeownership gap is starker in “riskier” neighborhoods.
It’s important to consider how historical lending practices persist long after passing the Fair Housing Act, which was created to protect people from housing discrimination, and how those historical practices will affect future policies, especially if policymakers are interested in expanding access to homeownership. PolicyMap added HOLC boundaries for several new cities and a new layer feature. Users can now look at new areas and overlay additional information with our multi-layer map functionality. Users can examine data related to housing like HMDA, Racial Homeownership, and average home value from the Census.
PolicyMap added data on the following cities:
Little Rock, AR; Phoenix, AZ; Pueblo, CO; Waterbury, CT; Stamford, Darien, and New Canaan, CT; Savannah, GA; Council Bluffs, IA; Davenport, IA; Sioux City, IA; Des Moines, IA; Dubuque, IA; Waterloo, IA; Peoria, IL; Topeka, KS; Covington, Kentucky; Shreveport, LA; Grand Rapids, MI; Jackson, MI; Lansing, MI; St. Paul, MN; Rochester, MN; Jackson, MS; Lincoln, NE; Omaha, NE; Union County, NJ; Lima, Ohio; Oklahoma City, OK; Tulsa, OK; Portland, OR; Bethlehem, PA; Harrisburg, PA; Lancaster, PA; Wilkes-Barre, PA; York, PA; Providence, RI; Pawtucket & Central Falls, RI; Woonsocket, RI; Columbia, SC; Memphis, TN; Nashville, TN; Amarillo, TX; Austin, TX; Beaumont, TX; El Paso, TX; Fort Worth, TX; Galveston, TX; Houston, TX; Port Arthur, TX; San Antonio, TX; Waco, TX; Ogden, UT; Salt Lake City, UT; Huntington, WV
Interested in learning more about or accessing the Historic Lending Boundaries? Contact us.