
When It Comes to Home Sale Data Look Local and Dig Deeper

National home sale data indicates that while the number of people buying homes has dropped due to high mortgage interest rates, median home sale prices nationally have not been declining at the same rates. Cities and towns across the United States are experiencing different versions of this story which is why going local when it comes to home sale trends is crucial. PolicyMap can help with zip code level home sale statistics which we update on a quarterly basis.
Zip code level data as of Q3 2022 for Philadelphia and Manhattan Borough in New York City (two areas with similar sized populations) indicates that while Manhattan is experiencing a greater drop in the number of home sales than Philadelphia, both have only a few zip codes where median home sale prices are declining.
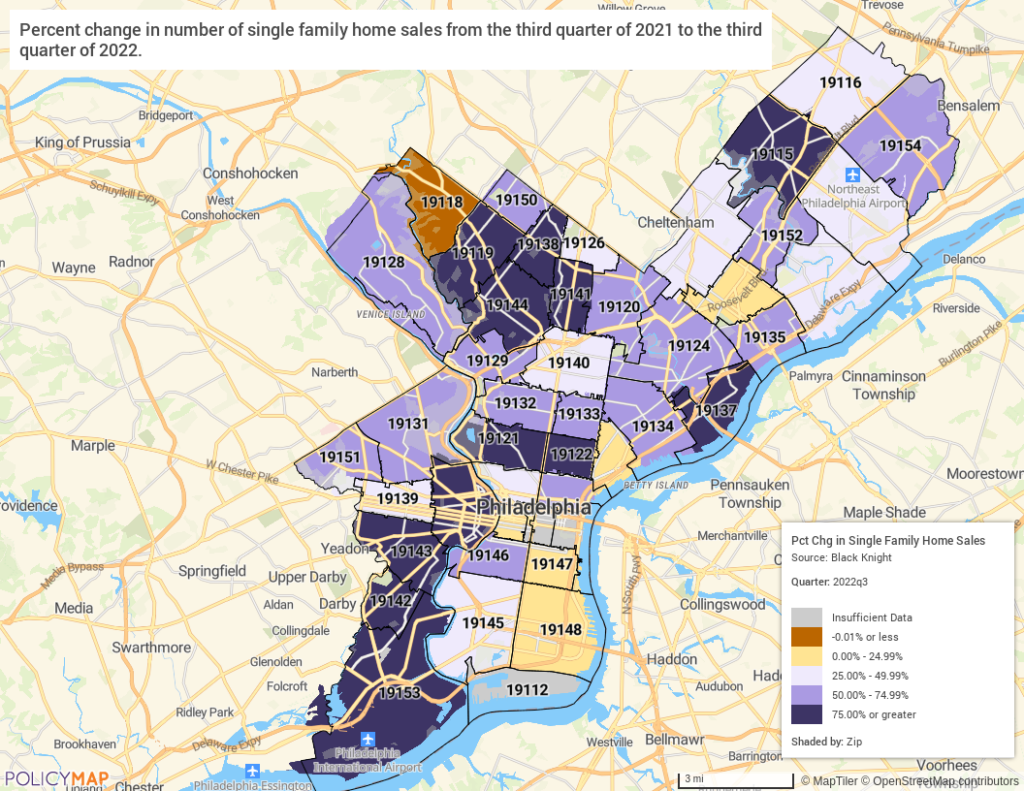
Number of Home Sales
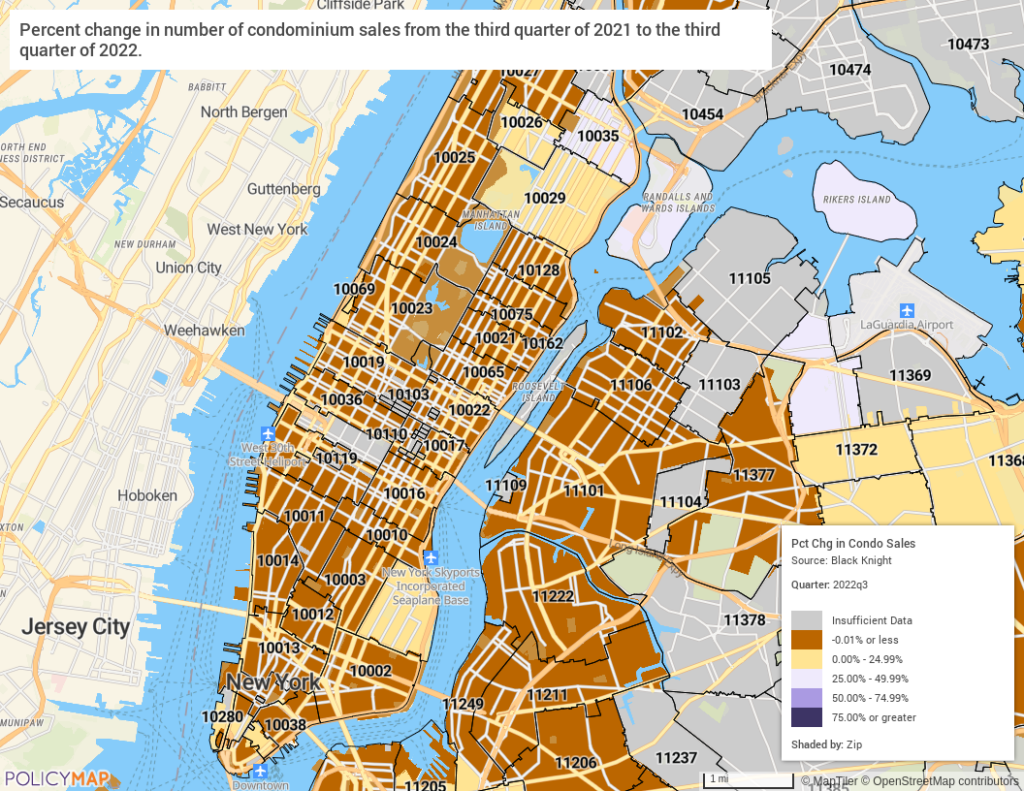
The latest quarterly data available in PolicyMap provides us with data for Q3 2022. PolicyMap allows us to look at how stats have changed from one quarter to the next, over the last four quarters or annually since 2008 at the zip code level. With so much conversation about the current state of the housing market, we can look at how the number of home sales changed from Q3 2021 to Q3 2022 in both Philadelphia and Manhattan. In both maps that follow, any zip code shaded the darkest orange saw a decline in the number of home sales between these two quarters. In Philadelphia, only one zip code (19118) experienced a decline and 11 zip codes saw the number of sales increase by 75% or more in Q3 2022 as compared to Q3 2021.
During the same time, all but 8 zip codes in Manhattan experienced a decline in the number of sales and none saw increases of 75% or greater as did Philadelphia. (Note: Sales in Manhattan are primarily comprised of condominium sales. The change in these sales is reflected on the map below.)
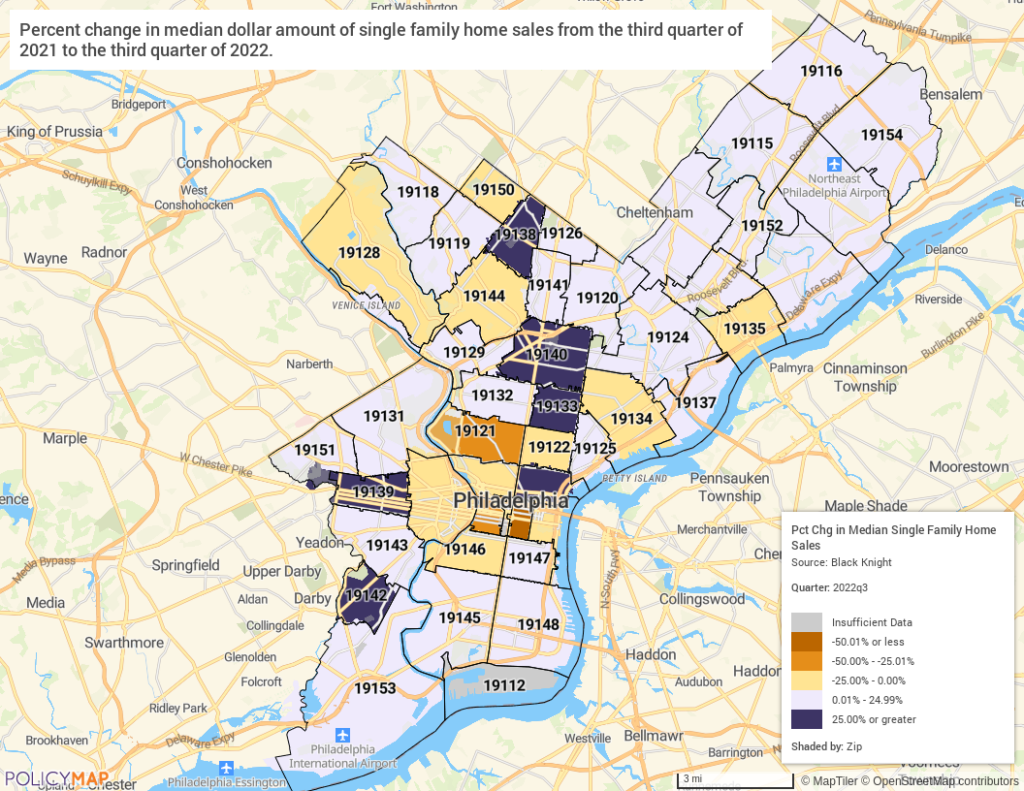
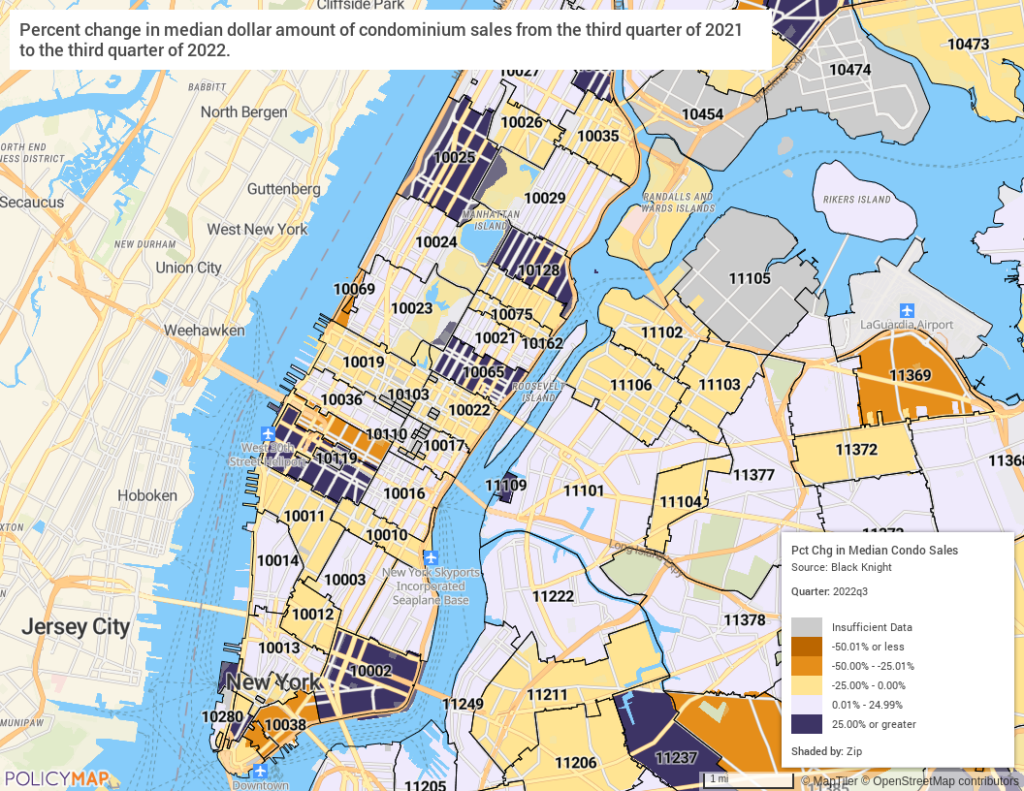
Median Home Sale Prices
When it comes to the change in median home sale prices, the two cities tell more similar stories, where median prices increased in about half of each city’s zip codes. In the maps that follow, any zip code shaded purple saw median home sale prices increase, while those shaded yellow and orange saw median prices decline.
In the coming months, we will be adding Q4 2022 and year end 2022 home sale data and will plan on providing a fuller analysis with these year end results. This data can be used in combination with any other data in PolicyMap, such as mortgage originations, incomes, population ages, housing cost burdens or real estate taxes to identify target areas for program development, strategic planning or site selection.
Let’s Get Local
Please reach out if you would like to learn more about the data in PolicyMap and how we can help your organization gain the insights you need to achieve your goals.