
Using PolicyMap Data to Find Equity at the Intersection of Housing and Opportunity in the US

Data
Home Mortgage Disclosure Act (HMDA) Summaries
Source
PolicyMap, Federal Financial Institutions Examination Council (FFIEC)
Find on PolicyMap
- Lending
- Mortgage Loans
- All Mortgage Originations
- Loans By Race
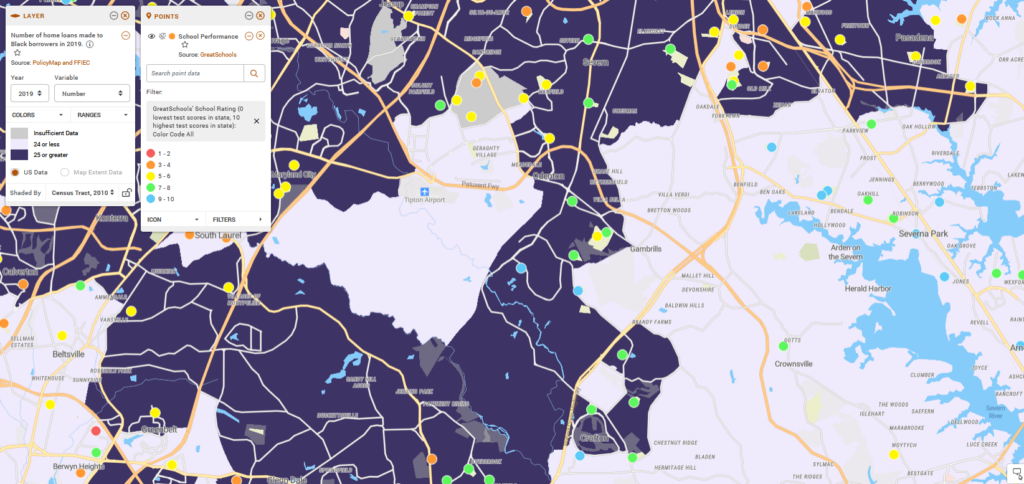
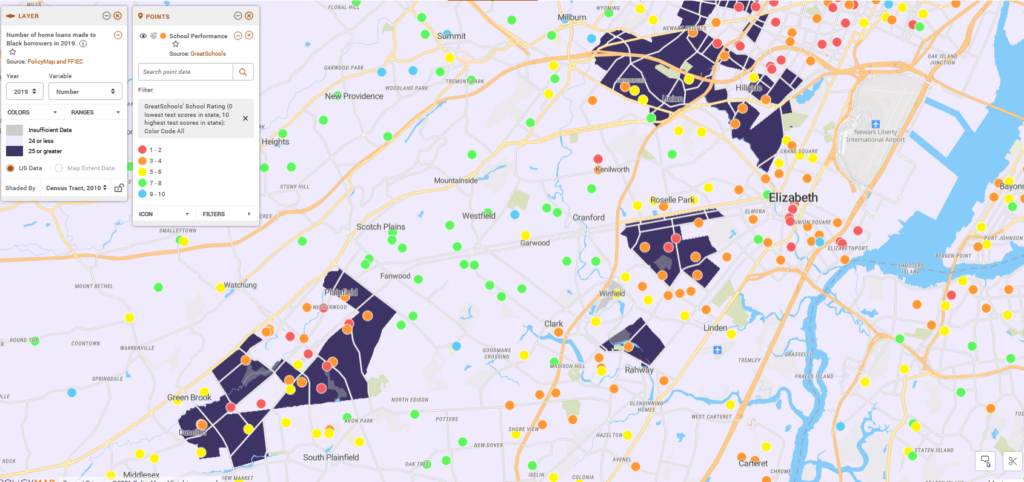
PolicyMap is a one-stop shop for visualizing nationally available data that can facilitate the open conversations needed to guide the implementation of fair housing practices in neighborhoods across the United States. Opportunities, such as proximity to high-performing schools, access to transit, or neighborhood amenities like libraries, can be visualized on a map and compared to where single parents with children live, where subsidized housing is located, or where people of color are buying homes. While this data can be viewed as single layers on PolicyMap, identifying places where factors intersect can provide deeper insights. These insights help, for example, to identify areas where greater numbers of people of color are buying homes and are able to access opportunities like higher-performing schools, as well as areas where people of color are buying homes and not able to access those same opportunities.
The two maps below show high-performing schools as green or blue dots and higher numbers of Black buyers as dark purple. The maps highlight vastly different dynamics and suggest that the implementation of fair housing policies in each of these places should also be different.
Data available in PolicyMap to help public policymakers analyze trends, zero in on areas of concern, and identify opportunities in need of support includes the following. Please contact us if you would like to learn more.
| Demographics of Fair Housing Protection |
|---|
| Households by Race and Ethnicity |
| Predominant Race |
| Sex |
| Age |
| People with Disabilities |
| Foreign-Born Population |
| Religious Affiliations |
| Familial Status |
| Segregation |
| Index of Dissimilarity (Theil Index) |
| Income and Poverty |
| Household Income by Race and Ethnicity |
| People in Poverty by Race and Ethnicity |
| Inequality of Income (Gini Index) |
| Concentrated Persistent Poverty |
| Homeownership |
| People of Color Who Own Their Home |
| People of Color Who Rent Their Home |
| Market Conditions |
| Market Value Analyses (for select cities) |
| Home Values |
| Home Sales |
| Historic Lending Discrimination |
| HOLC Risk Maps |
| Morgage Loans |
| Originations by Race |
| Loans by Race |
| Refis by Race |
| Prime Loans by Race |
| High Cost Loans by Race |
| Government Insured Loans by Race |
| Denials by Race |
| Financial Burdens |
| Housing Cost Burdens |
| Percent of Housing Cost Spent on Taxes |
| Federally Supported Housing |
| Households in Subsidized Housing by Race |
| Housing Supported by HUD |
| Housing Supported by USDA |
| USDA Single Family Loans by Race |
| Other Federal Investments |
| Stacked Tax Credits |
| NMTC Locations |
| Access and Opportunity |
| Upward Mobility Rate by Race |
| Internet Access by Race |
| High Performing Schools |
| Opportunity Indices |
| Census Low Response Score |
| Transit |
| Libraries |
| Access to Capital |
| Bank Branch Locations |
| Credit Union Branches |
| CDFI Locations |
| Environmental Burdens |
| Flood Zones |
| Superfund Sites |
| Brownfield Sites |
| Social Vulnerability Index |
| Lead Exposure Risk |