
Greenhouse Gas Reduction Fund
Mapping Environmental and Economic Disparities
Recent federal investments in clean energy, sustainable housing, and workforce development are geared towards benefiting disadvantaged communities (DACs). With PolicyMap, organizations can swiftly identify low-income and disadvantaged areas. By utilizing environmental and socioeconomic data from both public and proprietary sources, decision-makers can readily pinpoint neighborhoods that align with program objectives under the Inflation Reduction Act, Greenhouse Gas Reduction Fund, Justice40 Initiative, and other legislative measures.
Data-Driven Investments
Environmental and economic justice legislation promotes fair and sustainable development. The new funding recognizes the interconnectedness of social, economic, and environmental systems and creates a path for addressing underlying structural inequalities. How PolicyMap helps:
Strategic Deployment of Capital and Compliance
PolicyMap helps organizations prioritize resource and capital allocation, comply with government-mandated investment criteria such as the J40 initiative, and report to stakeholders. Using PolicyMap’s online platform containing 170+ public and proprietary data sources, users can bulk upload project locations to see all programming in one place, build multi-layer maps at granular geographies to align project locations with program requirements and build visually appealing reports that are easy to review, download and share.
Technical Assistance
PolicyMap bridges the gap between funding and project execution by providing awardees and Technical Assistance providers with the tools needed to understand and track the dynamics of local markets – from home sale prices to vacancy rates, to environmental risks, to health conditions, to demographic changes, to workforce needs – all in one application. With PolicyMap, users can additionally identify important resources and partners on the ground to support program implementation.
Locate Areas Burdened by Environmental and Economic Disparities
Unlock the power of PolicyMap and take meaningful action toward creating a more just and equitable future. Learn how our intuitive mapping platform and data analytics tools can help draw capital into your community.
Fill in the form to request more information.
How We Work
Whether through our intuitive online platform, seamless integration, or flexible data licensing options, PolicyMap empowers organizations with unparalleled access to comprehensive mapping and data analytics tools.

SaaS Platform
Users can access PolicyMap’s extensive mapping and data analytics tools through its intuitive and powerful online platform. Explore publicly available and proprietary data sources including CEJST, EPA, and CDFI Fund, create custom maps, and conduct analyses, no prior GIS-knowledge required.

Partner Portal
Organizations can integrate PolicyMap’s mapping and data capabilities seamlessly into their own website through the Partner Portal option. This white-label solution allows organizations to offer tailored access to PolicyMap’s datasets and tools under their own branding for members, partners, and/or TAs.

Data License
PolicyMap offers data licensing options for organizations looking to leverage its extensive datasets for their own applications, research, or analyses. Enhance your projects and initiatives with data that is curated, cleaned, normalized, and always from authoritative sources datasets.
Federal Programs Supporting
Environmental and Economic Justice
Unlock the potential for impactful change with PolicyMap, the most efficient solution for identifying areas eligible for federal funding under initiatives such as the Inflation Reduction Act, Justice40 Initiative, Greenhouse Gas Reduction Fund, and similar programs. With PolicyMap, organizations can instantly visualize and analyze socioeconomic indicators, environmental factors, and community demographics – all at the neighborhood level. Overlay different datasets from public and proprietary sources to identify areas that meet specific criteria, such as low-income communities with high greenhouse gas emissions.
Inflation Reduction Act
When it comes to energy and climate change, projects under the Inflation Reduction Act (IRA) are aimed at slashing carbon emissions, turbocharging energy innovation, and giving underserved communities the boost they deserve. A number of these incentives are designed to support clean energy investments in very specific low-income communities around the country. It’s all about leveling the playing field and bringing green opportunities to every corner of the country.
Greenhouse Gas Reduction Fund
The Inflation Reduction Act authorized the EPA to roll out the Greenhouse Gas Reduction Fund—a whopping $27 billion initiative poised to shake up the climate crisis battle and supercharge American economic prowess. The Greenhouse Gas Reduction Fund isn’t just about cutting emissions; it’s a game-changer for leveling the economic playing field and sparking fresh life into neighborhoods long overdue for a win.
Justice40 Initiative
Under the Justice40 Initiative, introduced by the Biden Administration, at least 40% of certain Federal investments, including many of those carried out through the IRA, must directly benefit these disadvantaged communities. Disadvantaged communities identified by CEJST face burdens across eight categories: climate change, energy, health, housing, legacy pollution, transportation, water and wastewater, and workforce development.
On The Blog
Maximize Justice40 Investments: Overlay CEJST Data with PolicyMap for Targeted Impact
New indicators from the Council on Environmental Quality’s Climate and Economic Justice Screening Tool (CEJST), including the overall disadvantaged community status and the disadvantaged status for the eight different categories of burden, are now in PolicyMap. Their inclusion allows organizations to target investments based on multiple criteria, including the Justice40 criteria, for more impactful clean energy strategies.

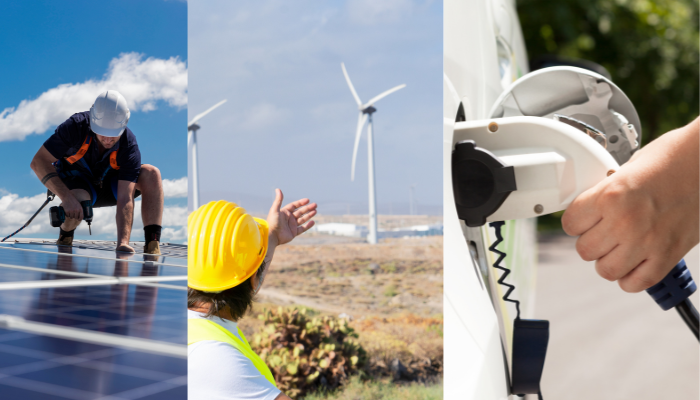
Identify Incentivized Locations for Solar, Wind, and EV Charging Facilities
When it comes to energy and climate change, the Inflation Reduction Act sets forth a series of incentives and direct investments for projects designed to reduce carbon emissions, increase energy innovation, and support underserved communities. As a result, a number of these incentives are designed to support clean energy investments in very specific low-income communities around the country. PolicyMap can help make the identification of these places simpler.
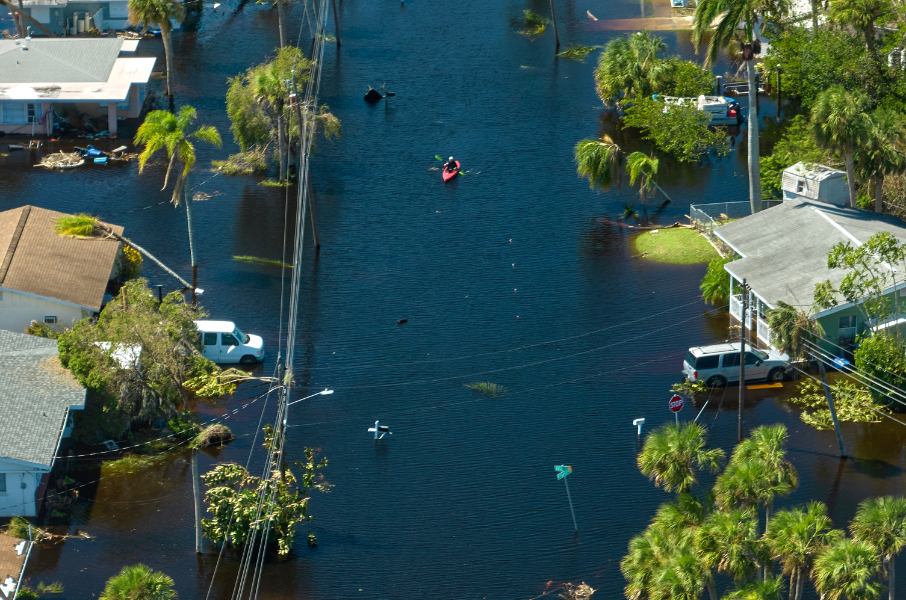
Mapping the Interplay of Flood Risks, Population Density, and Property Values in Southern Florida
Flood Zone Designations provide an in-depth risk analysis of flood hazard zones and serve as a poignant reminder of the escalating threats faced by numerous regions across the state. PolicyMap’s subscribers have access to a wealth of insights that possess the power to shape strategies, policies, and proactive responses to the pressing challenges at hand.
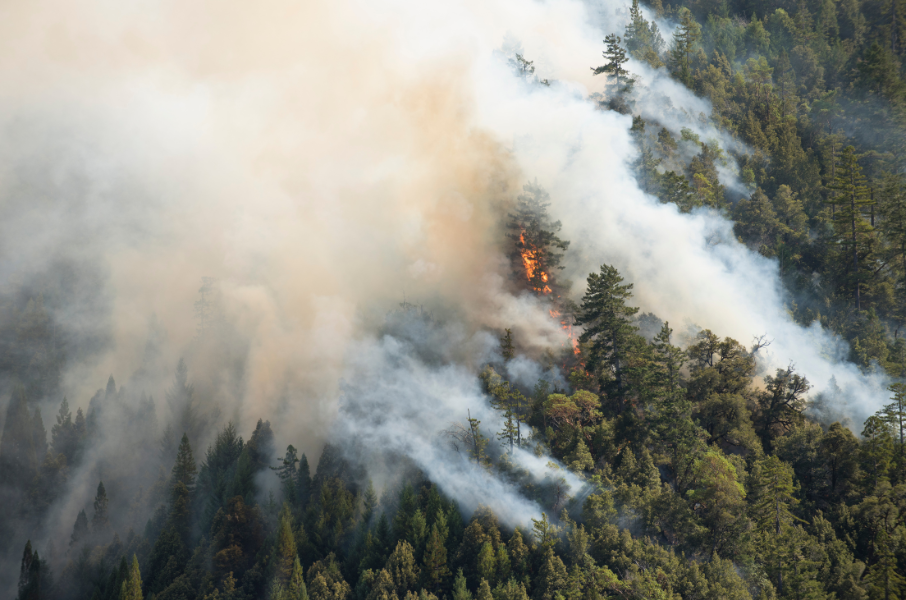
Which Communities Are Most At-Risk When Air Quality Diminishes?
When wildfires in Canada impacted the air quality in the northeast, doctors warned that some groups would be more susceptible to becoming ill and may need treatment in emergency rooms. PolicyMap data can help locate at-risk populations when environmental disasters strike.
The Best Data for Environmental and Economic Justice
PolicyMap blends environmental, economic, demographic, and neighborhood data to help organizations identify disadvantaged communities. With over 75,000 indicators at your fingertips, dig deeper into environmental and economic disparities in the neighborhoods you serve.

Demographics
Population, race and ethnicity, age, sex, languages, foreign-born, migration and immigration, households, families, homelessness, elections, religion

Incomes & Spending
Incomes, poverty, tax returns, federal benefits, bankruptcies, housing burdens, consumer spending, medical spending

Housing
Home sales, rents, building permits, residential & commercial vacancy, subsidized households, public housing, LIHTC

Lending
Mortgage originations, government-insured loans, refinance loans, mortgages by race, ethnicity, income, bank branches, credit unions, Historic Lending Boundaries

Quality of Life
Crime, broadband access, public transportation access, food access, farmers’ markets, environmental hazards, libraries, museums, parks, disaster risk

Economy
Jobs, unemployment, wages, small business, employment, workforce characteristics, oil and gas production

Education
School enrollment, educational attainment, graduation rates, school performance, cost of college, student loan debt, school locations, college locations, Head Start locations

Health
Infectious diseases, opioid use, chronic conditions, access to health care, health insurance, health risk factors, federal health programs, health facility locations, food access

Federal Guidelines
NMTC eligibility & investments, Opportunity Zones, persistent poverty, CDBG eligibility, housing opportunity index, CRA eligible areas, SBA HUB Zones, Promise Zones
Data available through PolicyMap is authoritative and current.
Let’s Talk.
Achieving environmental and economic justice is crucial for the long-term sustainability of both society and the planet. PolicyMap is essential for pinpointing areas in need of targeted interventions.
Ready to learn more? Fill in the form to request more information about our data sources.