
First Look: New Neighborhood-Level Health Indicators
When it comes to health, “Your ZIP code is more important than your genetic code.” Local disparities in health are a huge concern among people working in public health, environmental justice, and many other fields. Working across disciplines will be essential to resolving these issues. However, the lack of easy-to-understand, fine-grained health data is often a barrier to people who are accustomed to analyzing issues at the neighborhood level, like researchers in community and economic development. The most detailed health data is available only for the nation and states, and a limited set of information is available for counties.
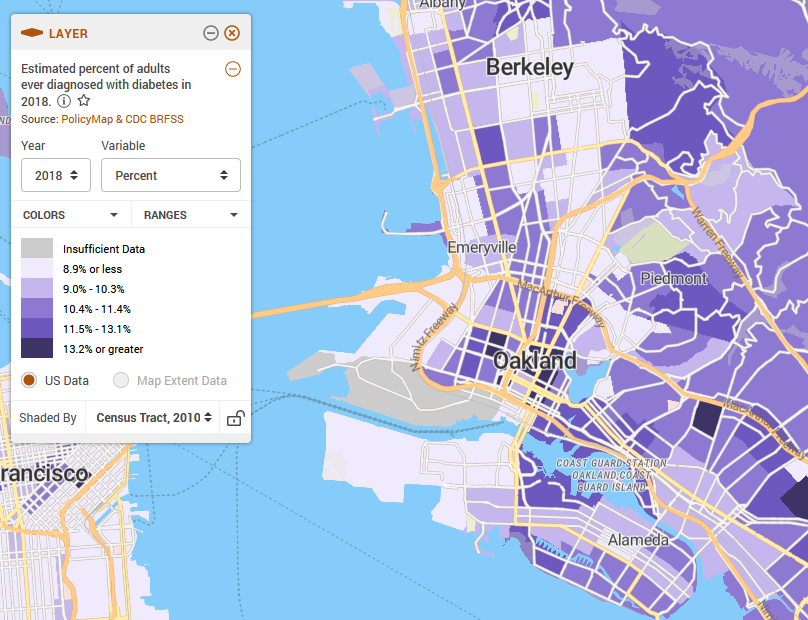
In response to that, we decided to make a set of key health indicators available at a smaller scale. You can now use PolicyMap to visualize a sub-county variation in health, using data from CDC’s Behavioral Risk Factor Surveillance System (BRFSS).
What is BRFSS?
The Centers for Disease Control coordinates the annual Behavioral Risk Factor Surveillance System survey. This phone survey of over 400,000 individuals has been conducted by state health departments for over 30 years, and is the largest governmental phone survey in the country. BRFSS asks questions about many individual behaviors that are known to affect health outcomes. BRFSS is an extremely valuable data source in the health world. In fact, the obesity, physical activity, and diabetes indicators we’ve used on PolicyMap in the past are county-level estimates that CDC created using the survey.
How do I pronounce it?
Does BRFSS rhyme with Earths? Versus? It’s up to you to tell us, because we don’t know.
Which indicators can I use?
We selected the most useful and compelling indicators from the survey, cross-referencing Healthy People 2020 goals. Additionally, in order to produce good nationwide estimates, we only chose variables with near-complete response from all participating states in 2013.
Our estimates for diabetes, physical activity, obesity, fruit and vegetable consumption, and self-assessed health are available for free to all users. You can find other indicators throughout the health menu that are available for subscribers only – access to preventative care, immunization, alcohol and tobacco use, seat belt use, and chronic health conditions.
How did you map it?
Health-risk behaviors and outcomes are, in many cases, strongly associated with socio-economic factors – what are commonly known as “social determinants of health.” We’ve taken advantage of this correlation, using logistic regression to predict local estimates based on characteristics of survey respondents: age, income, race, and area of residence (state as well as urban/rural/suburban area). Logistic regression predicts a response – in this case, answering Yes to a survey question – based on other variables in the data. ACS provides the needed demographic data at the census tract level and above, so can show the average percentage of people the model tells us would answer Yes to each question for census tracts, counties, census places, county subdivisions, and states.
While we hope a nationally-comparable health dataset has great value for our users, it’s impossible to create flawless estimates at this scale. Local surveys, where they exist, can provide information that is much more detailed and accurate.
How will you use our new BRFSS data in your work? Let us know on Twitter or in the comments!