
2017 ACS Data Released; New Data on Internet Access and Healthcare
The effort to bridge the digital divide just got a HUGE new resource, with Census American Community Survey data showing computer and internet access at the neighborhood level.
The Census released the 2013-2017 ACS data last week, and as usual, we’ve updated all of PolicyMap’s ACS data and added new indicators. (We’ve been working around the clock to get this data to you; you can read about how we did that last year.)
What’s New?
Here’s what’s new in this year’s update:
- All data updated to 2013-2017
- Older data moved one year forward, to 2008-2012
- New internet access and computer indicators (more below)
- Marital status indicators (see Demographics > Families > Family Type > Marital Status)
- College graduates by major (see Education > Population > College Graduates by Major)
- Health insurance coverage five-year change indicators (see Health > Health Insurance)
We’ll have more on the marital status and college major data soon, but for now, we’re going to look at the tech indicators.
Computer Access
In 2013, the ACS questionnaire began asking survey recipients three new questions: Does your household have some type of computer, an internet connection, and if so, what kind? The ACS needs five years of survey data before it can be released at the local (tract/block group) level, and after waiting patiently, that data has arrived.
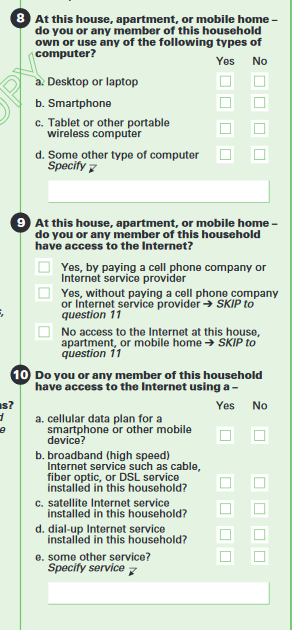
The first, most basic question dealing with technology access is: “Do you or any member of this household own or use any of the following types of computer?” The available answers are “Desktop or laptop”, “Smartphone”, “Tablet or other portable wireless computer”, and “Some other type of computer” (maybe a UNIVAC?).
What can this data tell us?
 First and foremost, a household that lacks access to any type of computer is going to be at a great disadvantage when it comes to banking, job searching, and learning, among many other activities. Finding ways to bring computers to these areas through the public library system, subsidies, or otherwise could be a top priority.
What if a household has access to a smartphone, but not a desktop or laptop computer? It used to be that if a household had a smartphone, it was on the cutting edge of technology. Today, there are households that may only have a smartphone, perhaps because it can only afford a smartphone, or doesn’t know the advantage of full computer (like writing a resume or working on projects).
Internet Access
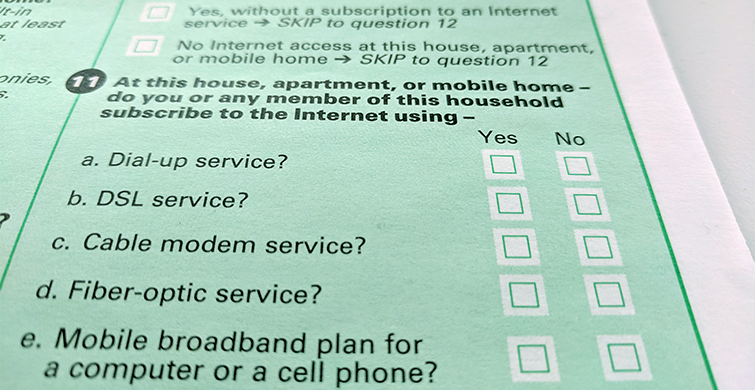
The ACS asks both whether the household has access to the internet, and what kind of connection it is. This is important, because not all connections are created equal. Today, a dial-up connection will severely limit the type of activities a user can engage in (PolicyMap won’t work). Even among broadband connections, mobile broadband or satellite won’t have the reliability or speed that cable or fiber-optic can provide (with DSL falling somewhere in between).
The real value of this data is its availability at the neighborhood level. Looking at St. Louis, whose northern half is sharply lower income and more non-white than it’s southern half, we can see the digital divide in stark terms:
There are also people with internet access, but not through a subscription. This may be through a citywide internet access program, a campus-provided internet connection, or sharing a neighbor’s wireless signal, among other ways.
One of the key purposes of this data is to find disparities in access among low-income and minority populations, because internet access has become an essential utility in recent years due to its necessity for everyday applications such as finding work and paying bills. For this, we can look at internet access by income group and race. Given the local spatial segregation that exists in many areas, this may be more useful at higher geographies, such as city or county. In other words, if a census tract is 90% low-income, it doesn’t tell you much to look at the low-income connectivity rate for that tract. However, if you look at the low-income connectivity rate for a city, it’ll give you a more complete picture of the disparities that exist.
For example, in Chicago, about 83% of the non-Hispanic white population has access to a broadband internet connection. That’s compared to 65% of the black population, and 74% among the Hispanic population.
Comparison to FCC Data
There is one other source of local broadband availability data, from the FCC. This data is also very useful, but it doesn’t give exactly the same kind of information. The FCC data comes directly from internet providers, and doesn’t say how many people in an area have a subscription, only that access is available.
Areas where the FCC shows broadband available, but ACS shows a low rate of subscription (or vice versa), can have a number of explanations:
- Broadband internet is available, but unaffordable for local residents
- Broadband internet is available, but other barriers, such as age, exist
- Broadband internet is only available in part of the area
- The data provided by the ISP is inaccurate
- There is a sampling error in the ACS
Additionally, the ACS has data on all types of internet connections; the FCC only has data on broadband connections, so it excludes dial-up.
These indicators are available in both the Quality of Life menu (under “Computer and Internet Access”) and Economy (under “Infrastructure”, “Computer and Internet Access”).