

All the data you need. All in one place.
We identify, collect, clean, and maintain accurate and timely data so you don’t have to. Gain the insights you need about communities and markets, while saving time and money.
Products & Services

Mapping & Analytics
Explore, map, and analyze thousands of datasets to understand patterns across neighborhoods, cities, and national markets.

Data Licensing
Millions of standardized U.S. socio-economic data points ready for analytics, enterprise systems, and AI-powered products.
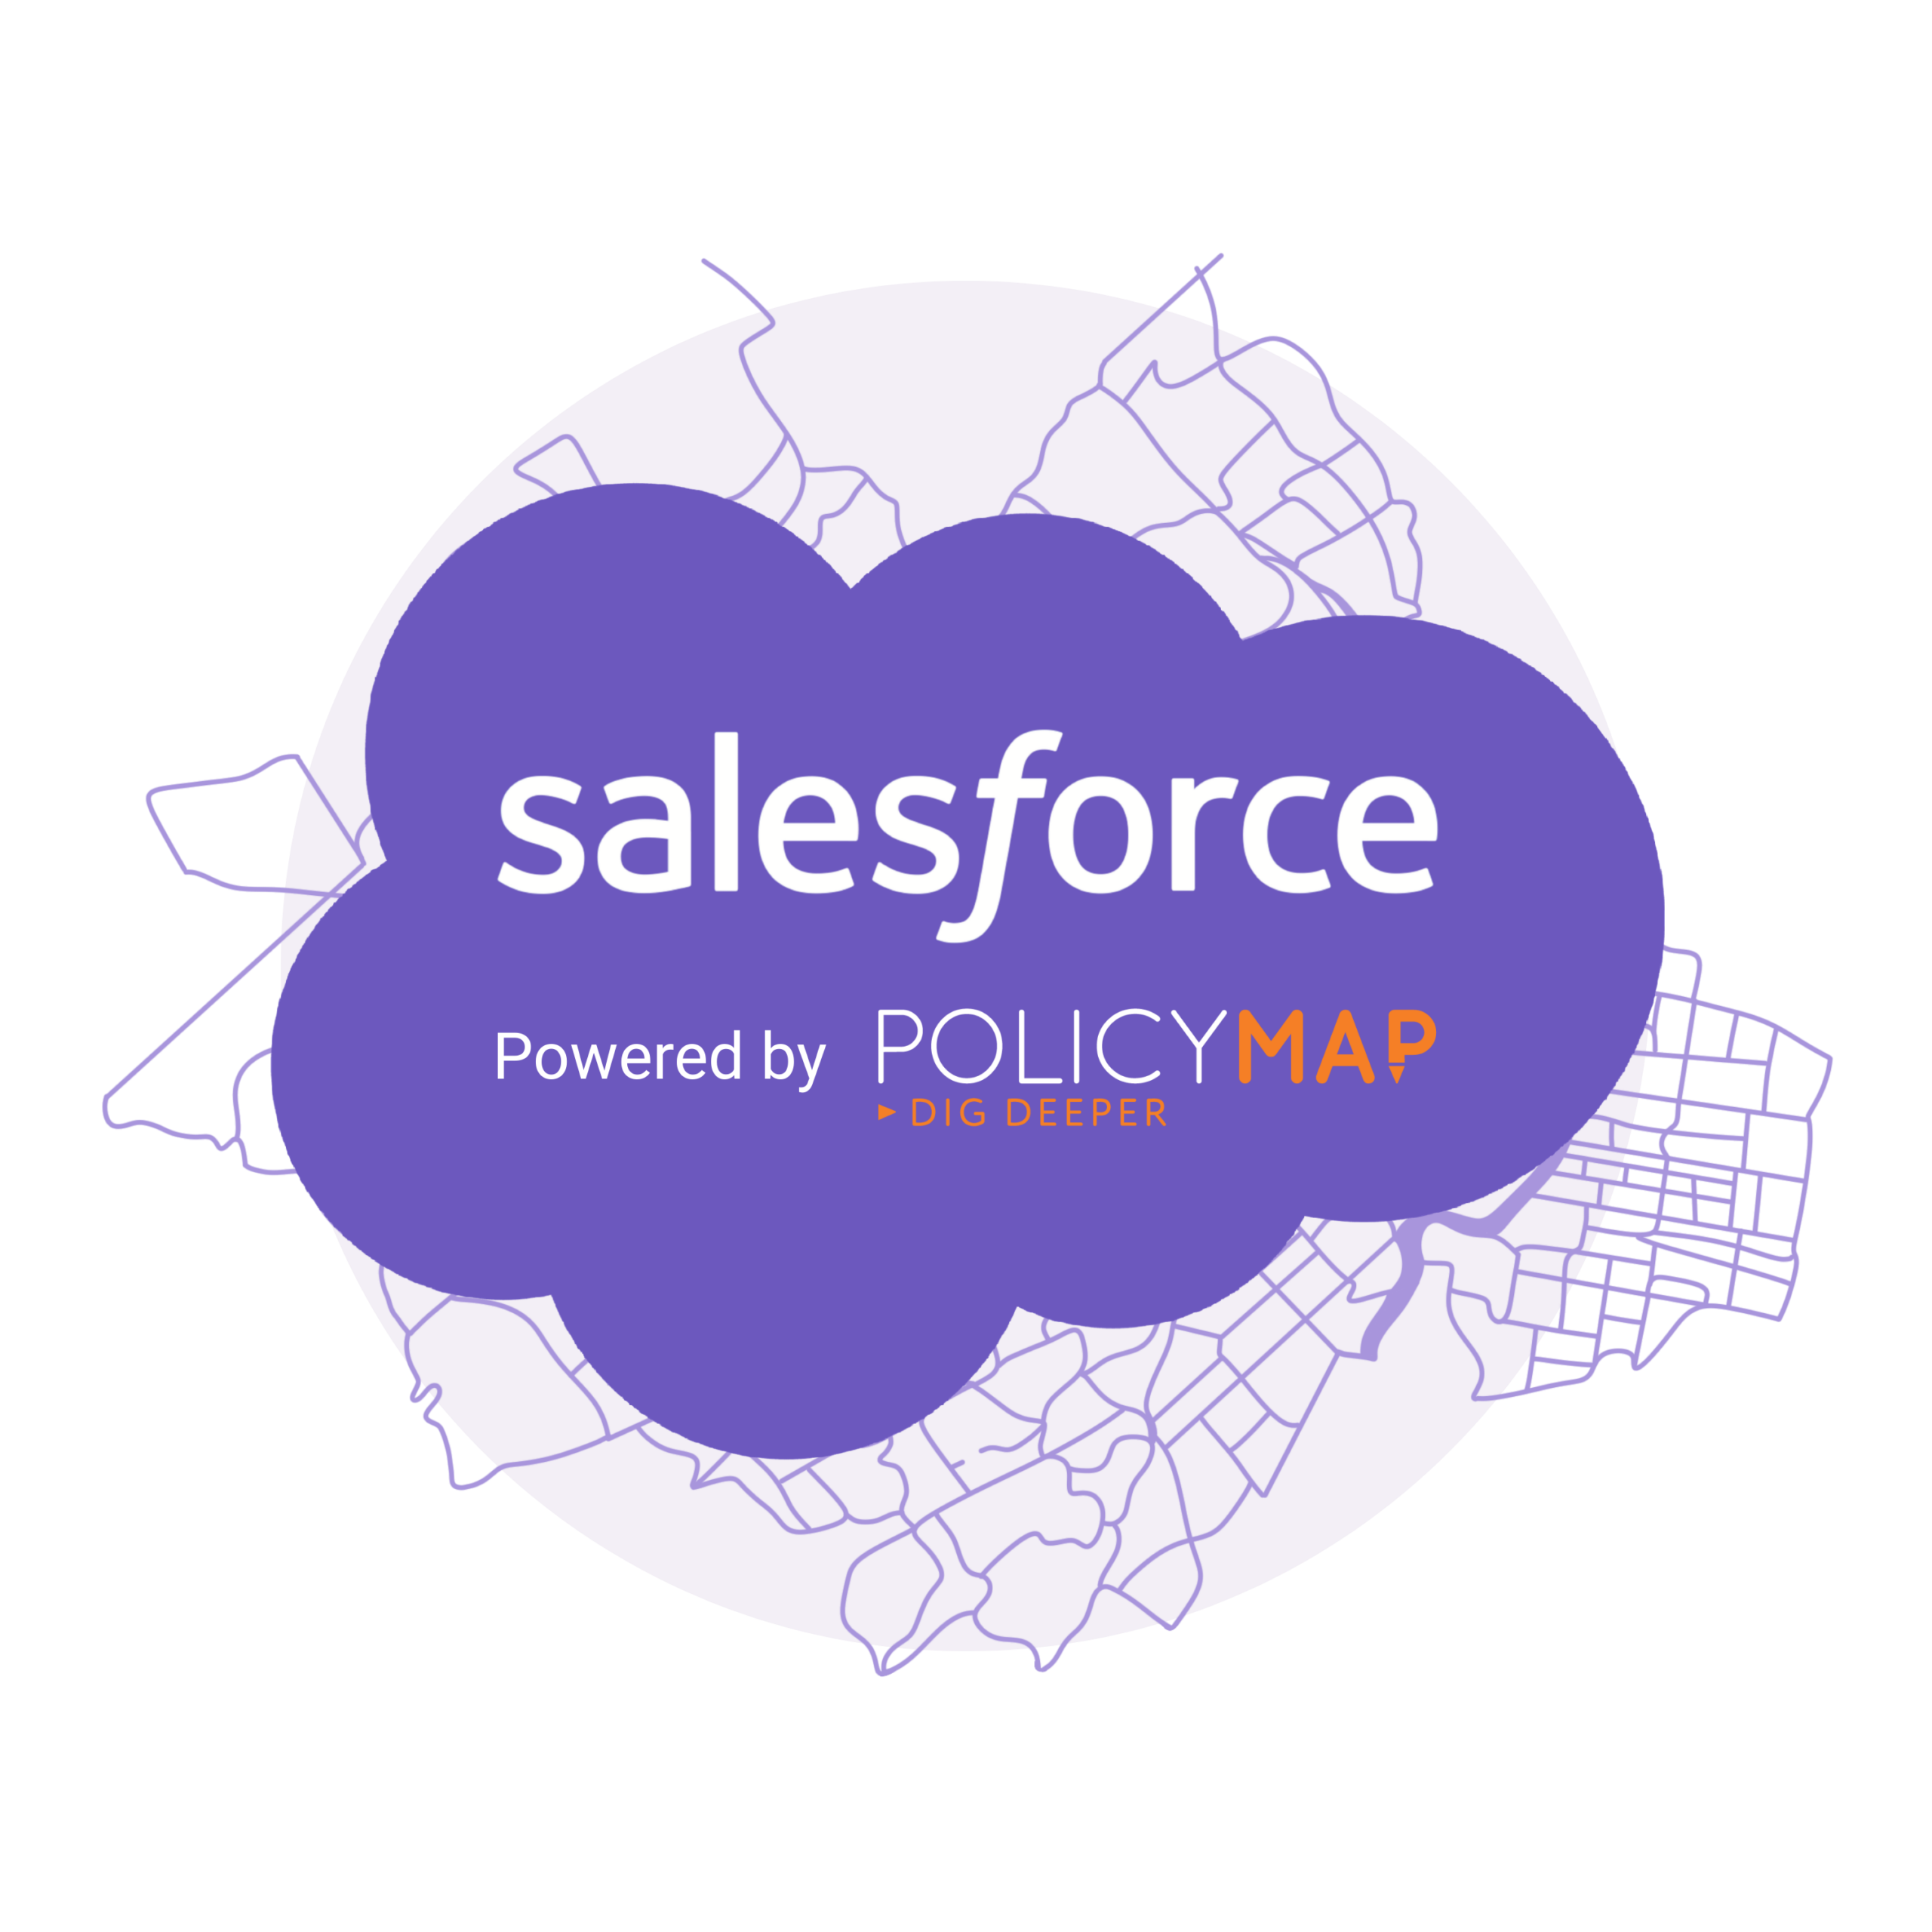
PolicyMap for Salesforce
Bring neighborhood-level data and map-based insights directly into Salesforce to support faster, more informed decisions.

Professional Services
Bespoke data, analysis, and dashboards tailored to your organization, delivering actionable, geography-driven insights for complex decisions.
Current Partners


In The News

Racial Disparity in Pregnancy Risk , opens in new tab
The New York Times worked with PolicyMap to show that Black women, in every state, have a higher rate of at least one pregnancy risk factor than white women.

Why Nobody Really Knows the Scale of the U.S. Housing Crisis , opens in new tab
The Washington Post examines why U.S. housing shortfall estimates range from 2 to 20 million homes, citing research from Moody's Analytics, PolicyMap, and Reinvestment Fund.
Blog
Let’s work together.
We help organizations work smarter with data.
Interested in learning more about PolicyMap, exploring our data warehouse, scheduling a personalized demonstration, or getting a quote?
Share a bit about yourself and your work, and we’ll be in touch in short order.