
Help students across disciplines understand geographic data without a specialized class.
PolicyMap brings research-ready data, sophisticated mapping, and powerful analytics to disciplines far beyond traditional GIS and planning. Students in fields like public health, sociology, and law can use PolicyMap to create maps, reports, and analyses that deepen their understanding of key issues in their areas of study.
Our extensive data library offers thousands of standardized and cleaned indicators from hundreds of trusted sources, eliminating the need to search through disparate datasets. With PolicyMap, students can focus on insights and exploration rather than data wrangling, unlocking new perspectives in their research and projects.
Dig deeper into geographic data. Use PolicyMap to explore trends and patterns down to the block group level. The map above displays the predominant racial or ethnic group for each block group in Philadelphia.
Join hundreds of top-tier colleges and universities that already subscribe to PolicyMap.


REQUEST A DEMO
See PolicyMap In Action
Request a personalized demo to learn how PolicyMap helps improve collection development, strategic planning, grant applications, community programming, and more.
Who We Help

Students
Students use the platform to create maps, reports, and analyses for coursework and projects, gaining practical experience with data visualization.

Resource Librarians
Librarians rely on PolicyMap to enhance library resources, supporting data literacy and providing access to reliable, ready-to-use datasets.
Researchers
Researchers leverage the extensive data library and analytics tools to uncover insights and drive impactful studies across various disciplines.

Faculty
Professors integrate PolicyMap into their teaching, using real-world data to illustrate concepts in fields like public health, urban planning, and sociology.
How We Help
Simple, Secure Access Through Your University Library
Colleges and universities can purchase enterprise licenses for their libraries and make access to PolicyMap available to all users via IP authentication or Single Sign On (SSO). No login required; library users may create their own individual accounts for storage of PolicyMap work products.
If your university uses a Single Sign On (SSO) tool to access its applications, PolicyMap can readily integrate with it. We have implemented SSO for many clients, using a variety of their SSO tools, such as OpenAthens, ADSF, Okta, and native SAML 2.0. We are happy to provide an implementation that will seamlessly integrate into the SSO system you use to manage your applications. Contact us for additional information.


Campus-Wide Access to Advanced Mapping Platform Features
Customize & Share Maps: Build visualizations that enhance lectures, coursework, and research. Easily share them in reports and presentations.
Layer Multiple Data Sources: Combine datasets seamlessly to explore relationships and patterns.
Annotate Maps: Highlight critical insights and add contextual notes directly to your maps.
Upload & Download Data: Incorporate your own research data or export findings into other GIS or analytics tools.
Build Reports & Dashboards: Create visual summaries to support your analyses.
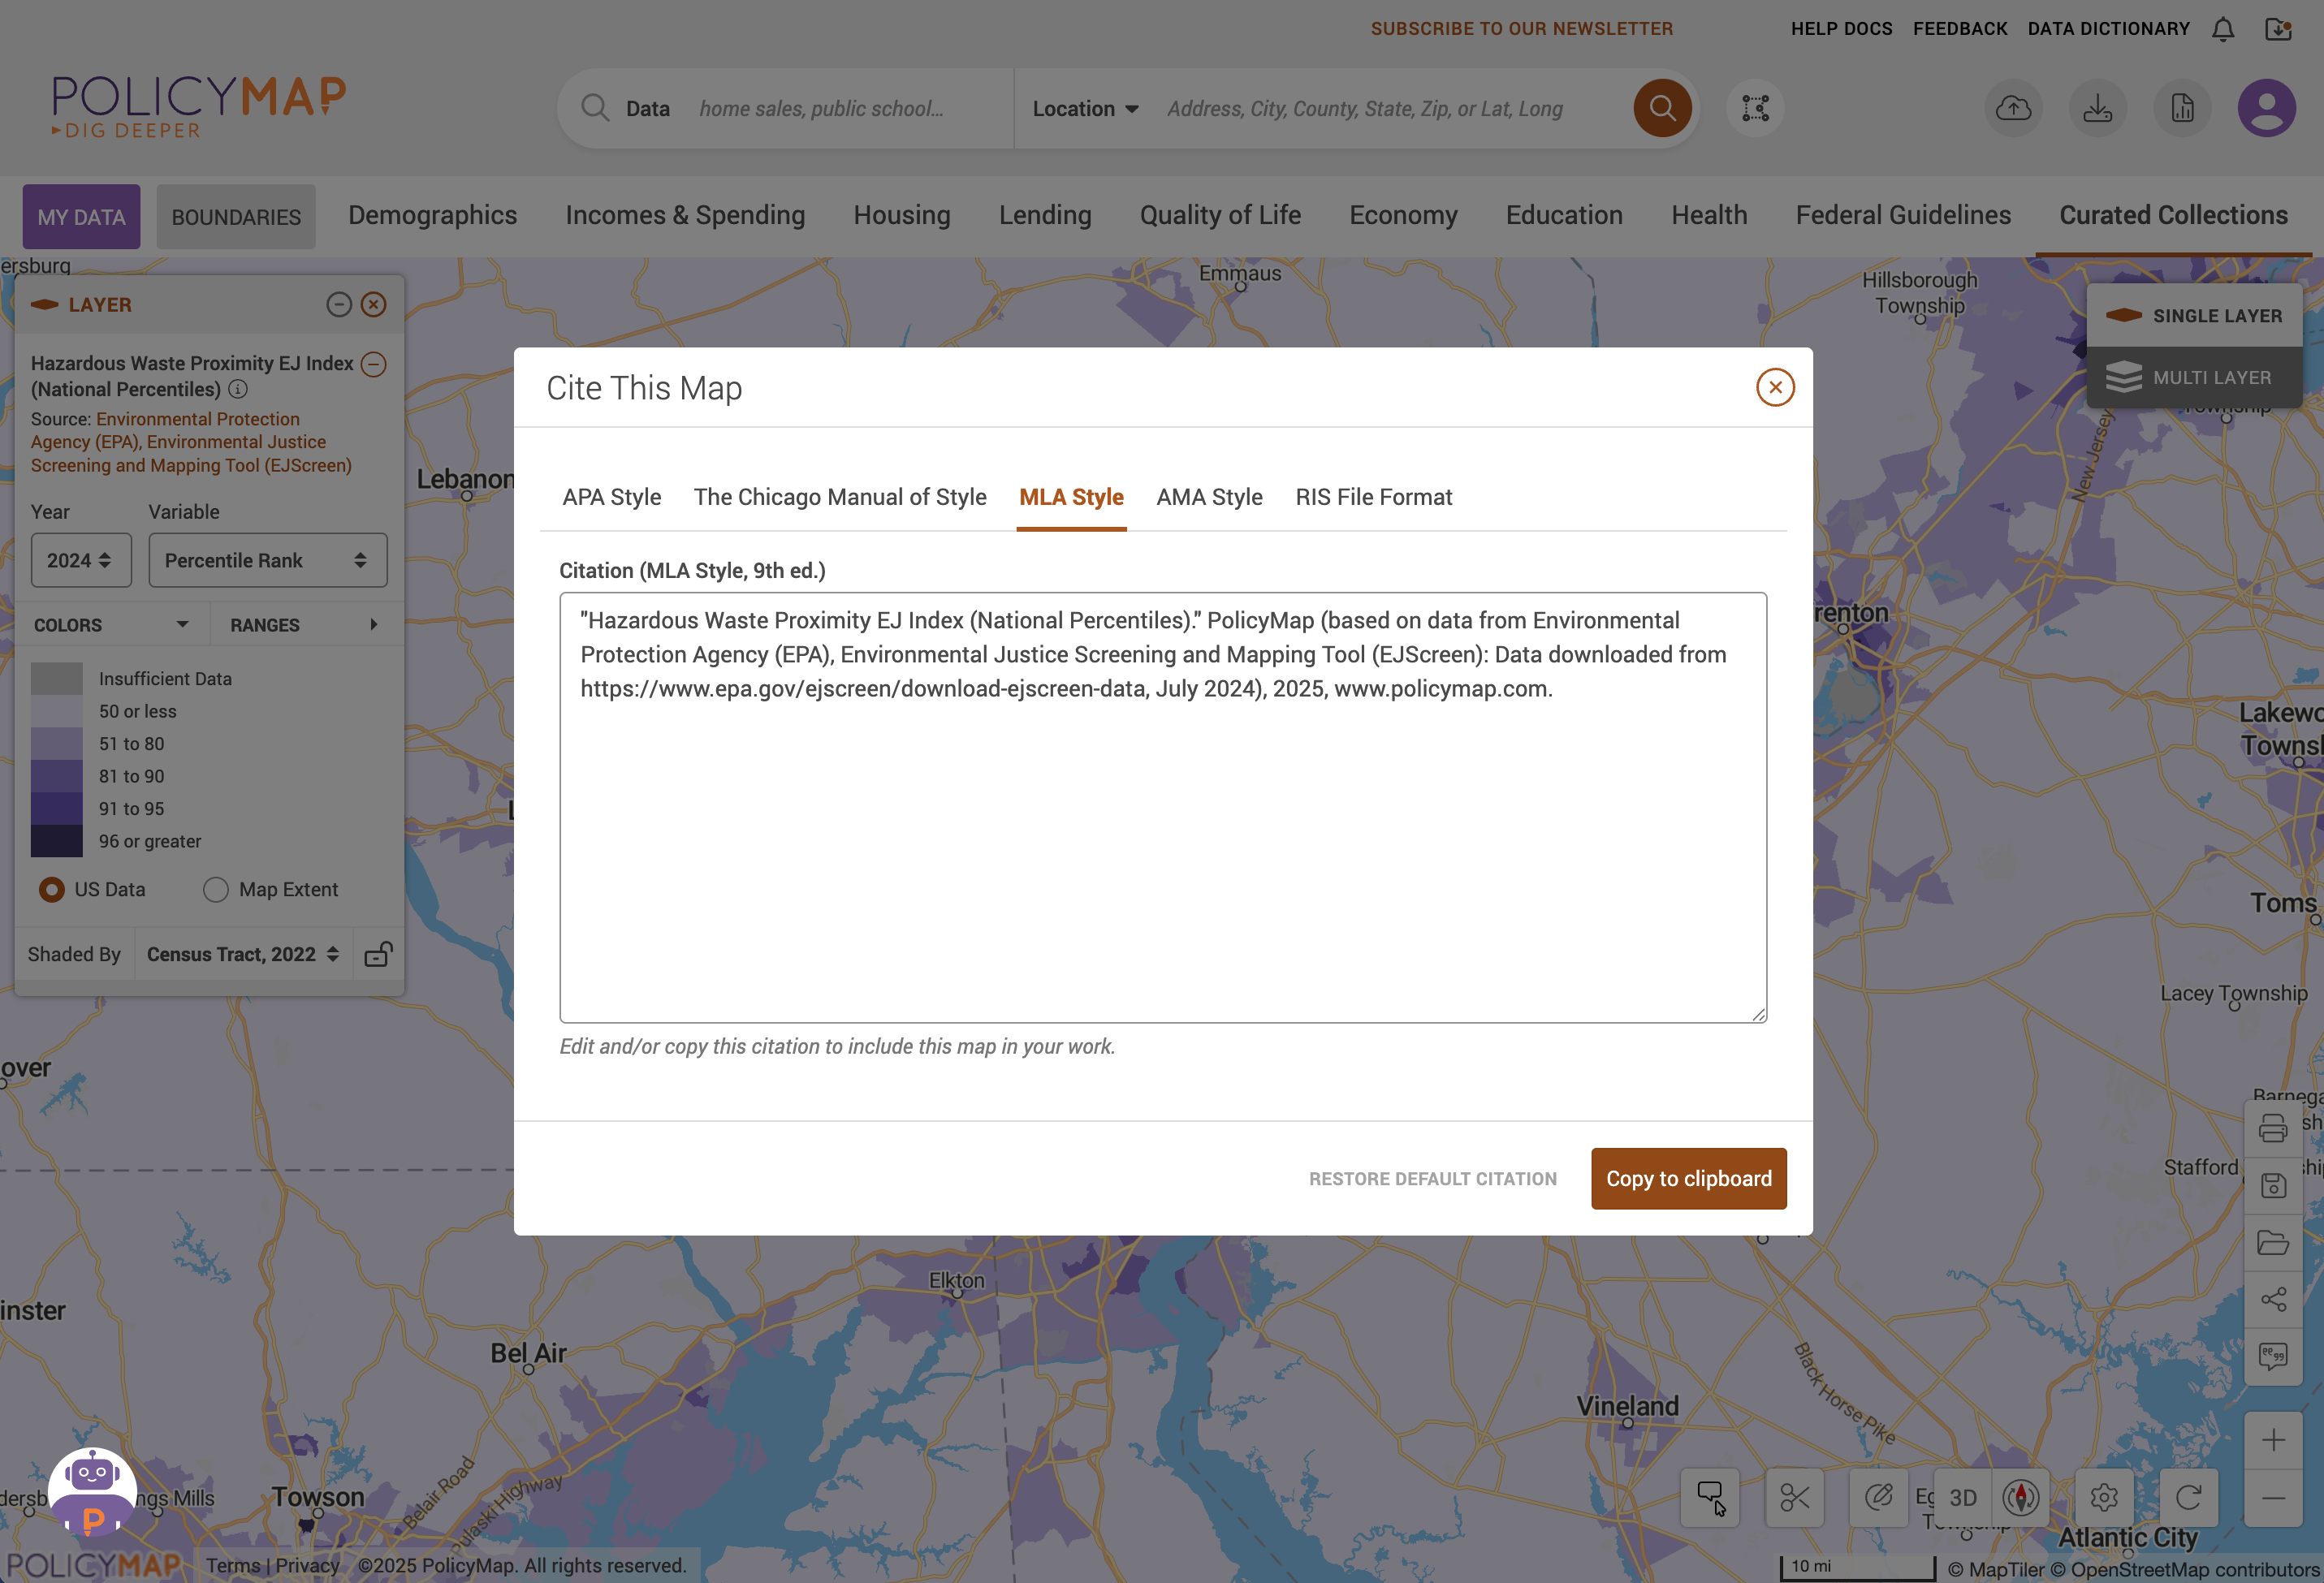
Generate Citations Instantly
Our Citation Generator is a quick and reliable way to credit PolicyMap as a source for research, essays, presentations, and other projects. It helps build credibility, supports verification, and ensures proper attribution while providing context about the data’s origin.
By handling the punctuation, italicization, and all those citation details, you save time and can focus on visualizing and interpreting your data. Choose from APA Style, The Chicago Manual Style, MLA Style, AMA Style, or RIS File Format.
Support & Training
We’re available Monday through Friday between 9 a.m. – 5:30 p.m. EST. Please be patient, We are a small but mighty team.
Didn’t find the answer you were looking for in our Knowledge Base? Found a bug? Click here to submit questions and/or feedback to our support team.
We invite anyone to join a free online training session to learn more about PolicyMap. Sign up for a session via the PolicyMap Training Calendar.
Research-Ready Data, Interdisciplinary Applications
PolicyMap is a powerful resource for universities, providing researchers and students with access to a wide range of data for interdisciplinary exploration. Whether used in social sciences, public health, or environmental studies, the platform enables users to analyze complex datasets, visualize trends, and uncover meaningful insights. Students can easily integrate data into coursework and projects, while researchers can rely on PolicyMap to support grant applications, publications, and collaborative studies. With its intuitive tools and reliable data, PolicyMap bridges disciplines and empowers academic communities to tackle real-world challenges.

Business

Community and Economic Development

Economics and Statistics

Education

Environmental Studies

Journalism

Political Science

Public Health

Public Administration
and Policy

Real Estate
Social Sciences
Urban Studies
and Planning
Subscription Vehicles


Subscription Options
Maps, Data, Analytics, Reports & Dashboards

Mapping Platform
cloud-based; annual subscription for individual, team, or enterprise

Bulk Data Delivery
via flat file, API, or Snowflake
Embedded Maps
add our maps and data to your website

Partner Portal
provide access for your partners or members

Curated Collections of Data
Social Determinants of Health, Clean Energy

Insights & Client Solutions
consulting and custom development
WEBINAR
Back to School with PolicyMap
PolicyMap’s Julia Park and Aaron Klein present new data additions, including the EPA’s Environmental Justice Screening and Mapping Tool (EJScreen), the Council on Environmental Quality’s Climate and Economic Justice Screening Tool (CEJST), new Census data, as well as the SDOH (Social Determinants of Health) Curated Collection.
Be the first on campus to know about PolicyMap’s enhanced platform features, such as map extent, custom colors, better print quality, new RIS citation format, and more. We’ll also introduce our Knowledge Center and PAM, our online helper.

BROCHURE
Developing Data-Savvy Future Leaders
Want to bring GIS insights without specialized classes to your college or university? PolicyMap empowers students, faculty, researchers and administrators with place-based data to answer research questions across disciplines. To learn more data sources and topics, download our brochure.