
Dig Deeper With Maps
We help people make smarter decisions with data.
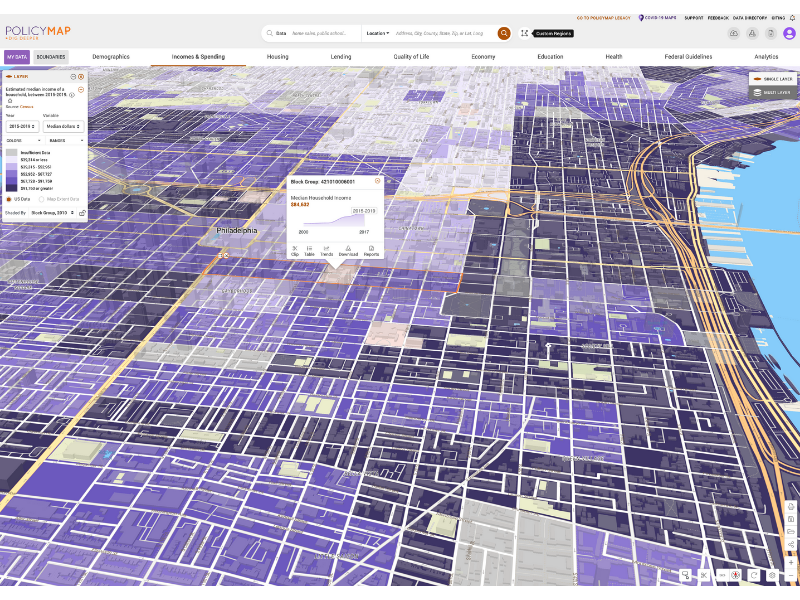
Create compelling, interactive maps with PolicyMap.
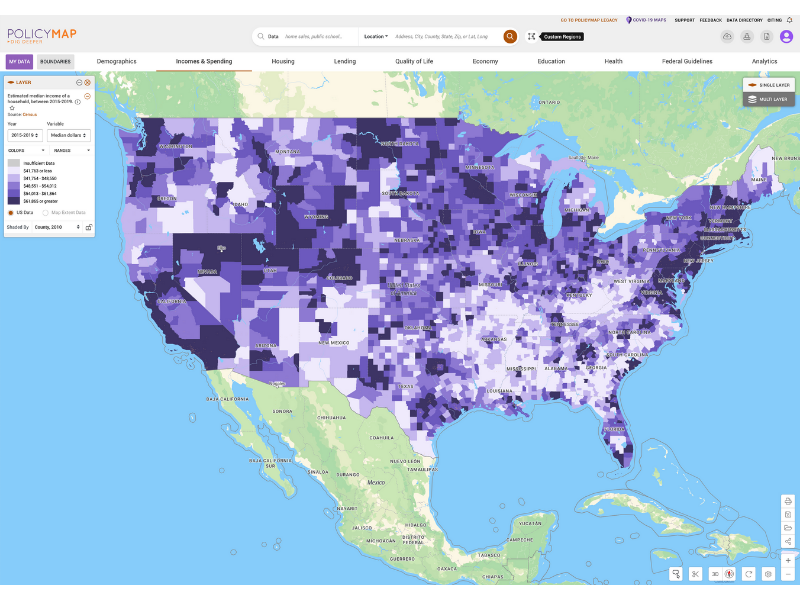
Build visualizations to better understand neighborhood conditions. Assess community health through medical and non-medical (SDOH) factors. Analyze racial and ethnic disparities. Evaluate the safety, quality and cost of housing. Then invest smarter to improve outcomes.
Inform community and housing needs assessments. Strengthen grant applications. Bolster intervention strategies. Accomplish more by targeting efforts where they are needed most.
Teach spatial and data literacy without GIS or coding knowledge requirements. College and graduate school professors around the country enhance lectures, coursework, and research with PolicyMap.
Making maps is fast and intuitive, no training needed.
Begin by specifying a location. Enter an address, city, state, zip code, or choose a standard geography type like block group, census tract, school district, metro area, congressional district, etc.
Then add data to the map. Easily search through PolicyMap’s exclusive, proprietary and gold-standard public indicators, and/or upload your own address-level data.
You can customize data layers, data points, and the map’s overall appearance. Save, print, download, and/or export to publish your map and share your insights.
Ask us about subscriptions based on number of users or organization wide-licenses.
Mapped data increases your capacity for change.
Share a bit about yourself below and we’ll follow up to schedule your personalized demonstration.
Unlock Insights
Focus on interpreting data, not on time-intensive data collection.
Tell Better Stories
Maps reveal what is not always evident in spreadsheets and tables of data.
Make An Impact
Solve real-world problems faced
by real people in real places.