|
|
|
|
|
|
|
|
|
FEATURED POST |
|
|
New Data Package: License PolicyMap’s Housing and Community Development Finance Data
A new curated data package focused on Housing and Community Development Finance is now available for license from PolicyMap. Drawing on more than 80 U.S.-based data sources, the collection covers federal housing and community development programs. Explore the data ranging across a wide range of geographies, from Census tracts and ZIP codes up to states and metro areas.
|
|
|
|
|
|
 |
|
|
LIVE WEBINAR |
|
|
 |
|
The Data Behind Philadelphia’s Housing Plan
Join us Tuesday, July 28th at 2pm EST
Join PolicyMap’s Office Hours for a special session on one of the most pressing challenges facing American cities: the housing shortage.
Mark Zandi, Chief Economist at Moody’s Analytics, opens with a look at the economics behind the housing crisis, followed by a new methodology that pinpoints exactly where housing is needed most across 350 US cities. Then we go local: we’ll break down how this same tract-level analysis helped shape Philadelphia’s $2 billion, 30,000-unit housing plan — one of the most ambitious in the country.
Hosted by Maggie McCullough, Founder and CEO of PolicyMap, this interactive session brings together city leaders, economists, and housing experts to show how census-tract-level data can guide investment decisions and direct housing production where it’s needed most.
Register Now |
|
|
|
 |
|
|
ON THE BLOG |
|
|
 |
|
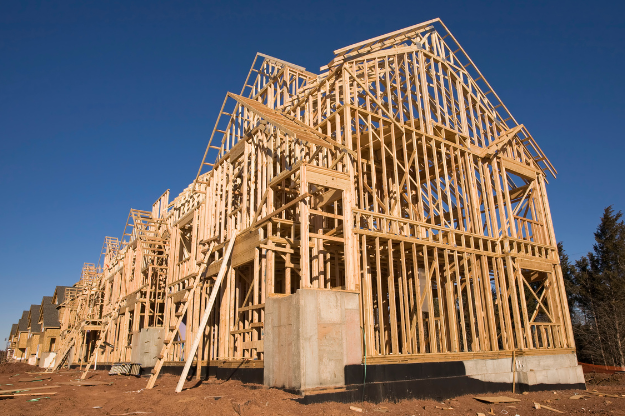
America’s Housing Shortage Persists: PolicyMap and Reinvestment Fund Update Census Tract Level Housing Gap Analysis Using Latest Data from American Community Survey
America’s housing shortage isn’t letting up. Despite adding 465,000 new homes across 350 major cities, the gap between housing supply and demand remains stuck at roughly 831,000 units — about 2% of total housing stock. New data shows the shortage continues to hit workforce renters the hardest. Explore the updated census tract-level maps to see where the shortfall hits hardest in your community.
Read More |
|
 |
|
How We Used the Moody’s Analytics Housing Gap Data to Craft a $2 Billion, 30,000 Unit Housing Plan in Philadelphia
Philadelphia’s $2 billion HOME initiative takes a data-driven approach to solving the city’s housing crisis, targeting the creation and preservation of 30,000 units. With housing gap estimates from Moody’s Analytics, PolicyMap, and Reinvestment Fund guiding every step, the plan aligns funding, location, and affordability with precision. See the data that is driving real-world change in one of America’s most housing-challenged cities.
Read More |
|
|
 |
|
|
DATA COLLECTION |
|
|
 |
|
PolicyMap’s Housing & Finance Data Collection is Available Now!
Understanding housing affordability, real estate market dynamics and the availability of tax incentives to spur investment at the neighborhood level can open the door to cost-effective and needed housing interventions.
Go beyond demographics with PolicyMap’s Housing & Finance Data Collection!
Explore the Data |
|
|
|
|
 |
|
 |
|
The Cost of College dataset has been fully refreshed and updated to the 2023-2024 school year, now with broader institutional and degree-level coverage.
CMS Medicare Accepting Provider locations have been updated to the most recent 2026 data.
PolicyMap and Quantitative Innovations Medical Spending Estimates have been updated to 2023.
Migration data from the IRS has been updated to 2022 data.
Data layers on Energy Community designations have been updated in PolicyMap through the 2026 eligibility criteria.
PolicyMap now includes Surgo’s maternal health data as part of every subscription, expanding access beyond its previous availability to only nonprofit and academic users.
We are committed to our promise of curated, cleaned, standardized, and always updated data. We’re posting real-time updates on our website, LinkedIn and BlueSky.
|
|
|
|
 |
|
Published Research
Explore scholarly works from students and researchers using PolicyMap.
University Anchor Initiatives and Gentrification Vulnerability: Predictors of Neighborhoods Targeted by Place-Based Development Initiatives, published in AERA Open
Open PolicyMap Training Sessions
Offered twice a week. Register here.
Level 1: Learning the basics of PolicyMap
Level 2: Learn the Data Loader, Multi-Layer Maps, and other Advanced Features
Open to non-subscribers. Course times rotate weekly. Don’t see a time that works for you?
Contact us.
|
|
|
|
 |
|
Join Us!
Back to School with PolicyMap
An annual webinar for academic users
Tuesday, August 18th 2026
1:00pm – 2:00pm EST
This engaging online webinar is designed for professors, researchers, students, and librarians looking to enhance their research and teaching with PolicyMap’s data and tools.
Your PolicyMap subscription puts 75,000+ indicators from 170+ sources at your fingertips, so you can map, analyze, and export data with no technical background required. We’ll highlight classroom applications across a range of disciplines — including public health, social sciences, marketing, economics, social work, and urban planning — so you can bring PolicyMap into your research and curriculum.
Live Q&A will take place after the webinar.
Register here to claim your seat!
|
|
|
|
|
|