|
|
|
|
|
|
|
|
|
FEATURED POST |
|
|
Affordability Series, Part 2: Where Homes Got Furthest Out of Reach
Affordability has become the defining issue of this midterm cycle, and housing is at the center of it, with first-time buyers now making up just one in five home purchases. In Part 2 of our Affordability Series, Claude, connected to PolicyMap’s upcoming MCP server, maps where home prices pulled furthest from local incomes, ZIP code by ZIP code. Between 2009 and 2022, the number of ZIP codes where the median home cost more than five times local income more than doubled, from about 1,640 to about 3,680, with the fastest spread in once-affordable places like Arizona, Nevada, and Florida. See how your state compares, and what the gap means for the strategies ahead.
|
|
|
|
|
|
 |
|
|
ON THE BLOG |
|
|
 |
|
Introducing PolicyMap’s Affordability Series: New Data on the Cost of Living in America
The cost of everyday life is climbing nationwide, and the pressure looks different depending on where you live. PolicyMap’s new Affordability Series centralizes housing, transportation, childcare, food, and healthcare cost data into curated packages built for faster, geography-specific analysis. Read more about what’s included and what’s coming next.
Read More |
|
 |
|
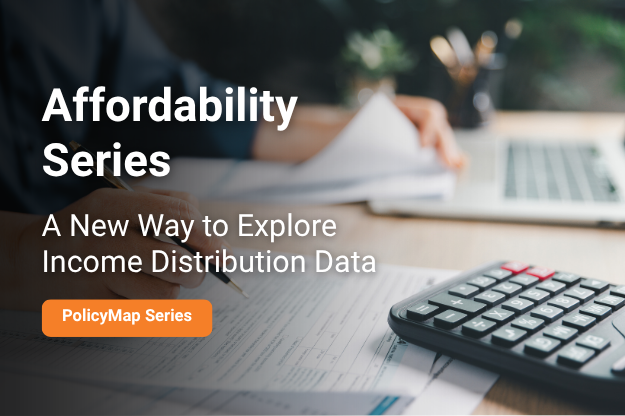
Affordability Series, Part 1: A New Way to Explore Income Distribution Data
Median income and poverty rates tell part of the story, but they don’t always capture the full economic makeup of a community. PolicyMap’s new Income Distribution Index offers a single, clear view of whether an area skews lower, moderate, or higher income, filling a gap that averages and medians leave behind. Read more about how it works and how to use it in your analysis.
Read More |
|
|
|
 |
|
|
CUSTOMER STORY |
|
|
 |
|
Data Science Camp Inc.
Each summer, the University of the District of Columbia’s College of Agriculture, Urban Sustainability & Environmental Sciences (CAUSES) and Data Science Camp Inc. (DSCI) run the STEAAM Camp, a six-week, in-person business intelligence program for DC high school students ages 14 to 18. Alongside industry experts, learners practice data mining, data assessment, and critical thinking as they define a problem, analyze data, and present their findings in a final capstone. To help them see how data tells stories about the communities around them, STEAAM Camp brought PolicyMap into this year’s program.
Read More |
|
|
 |
|
|
UPCOMING WEBINAR |
|
|
 |
|
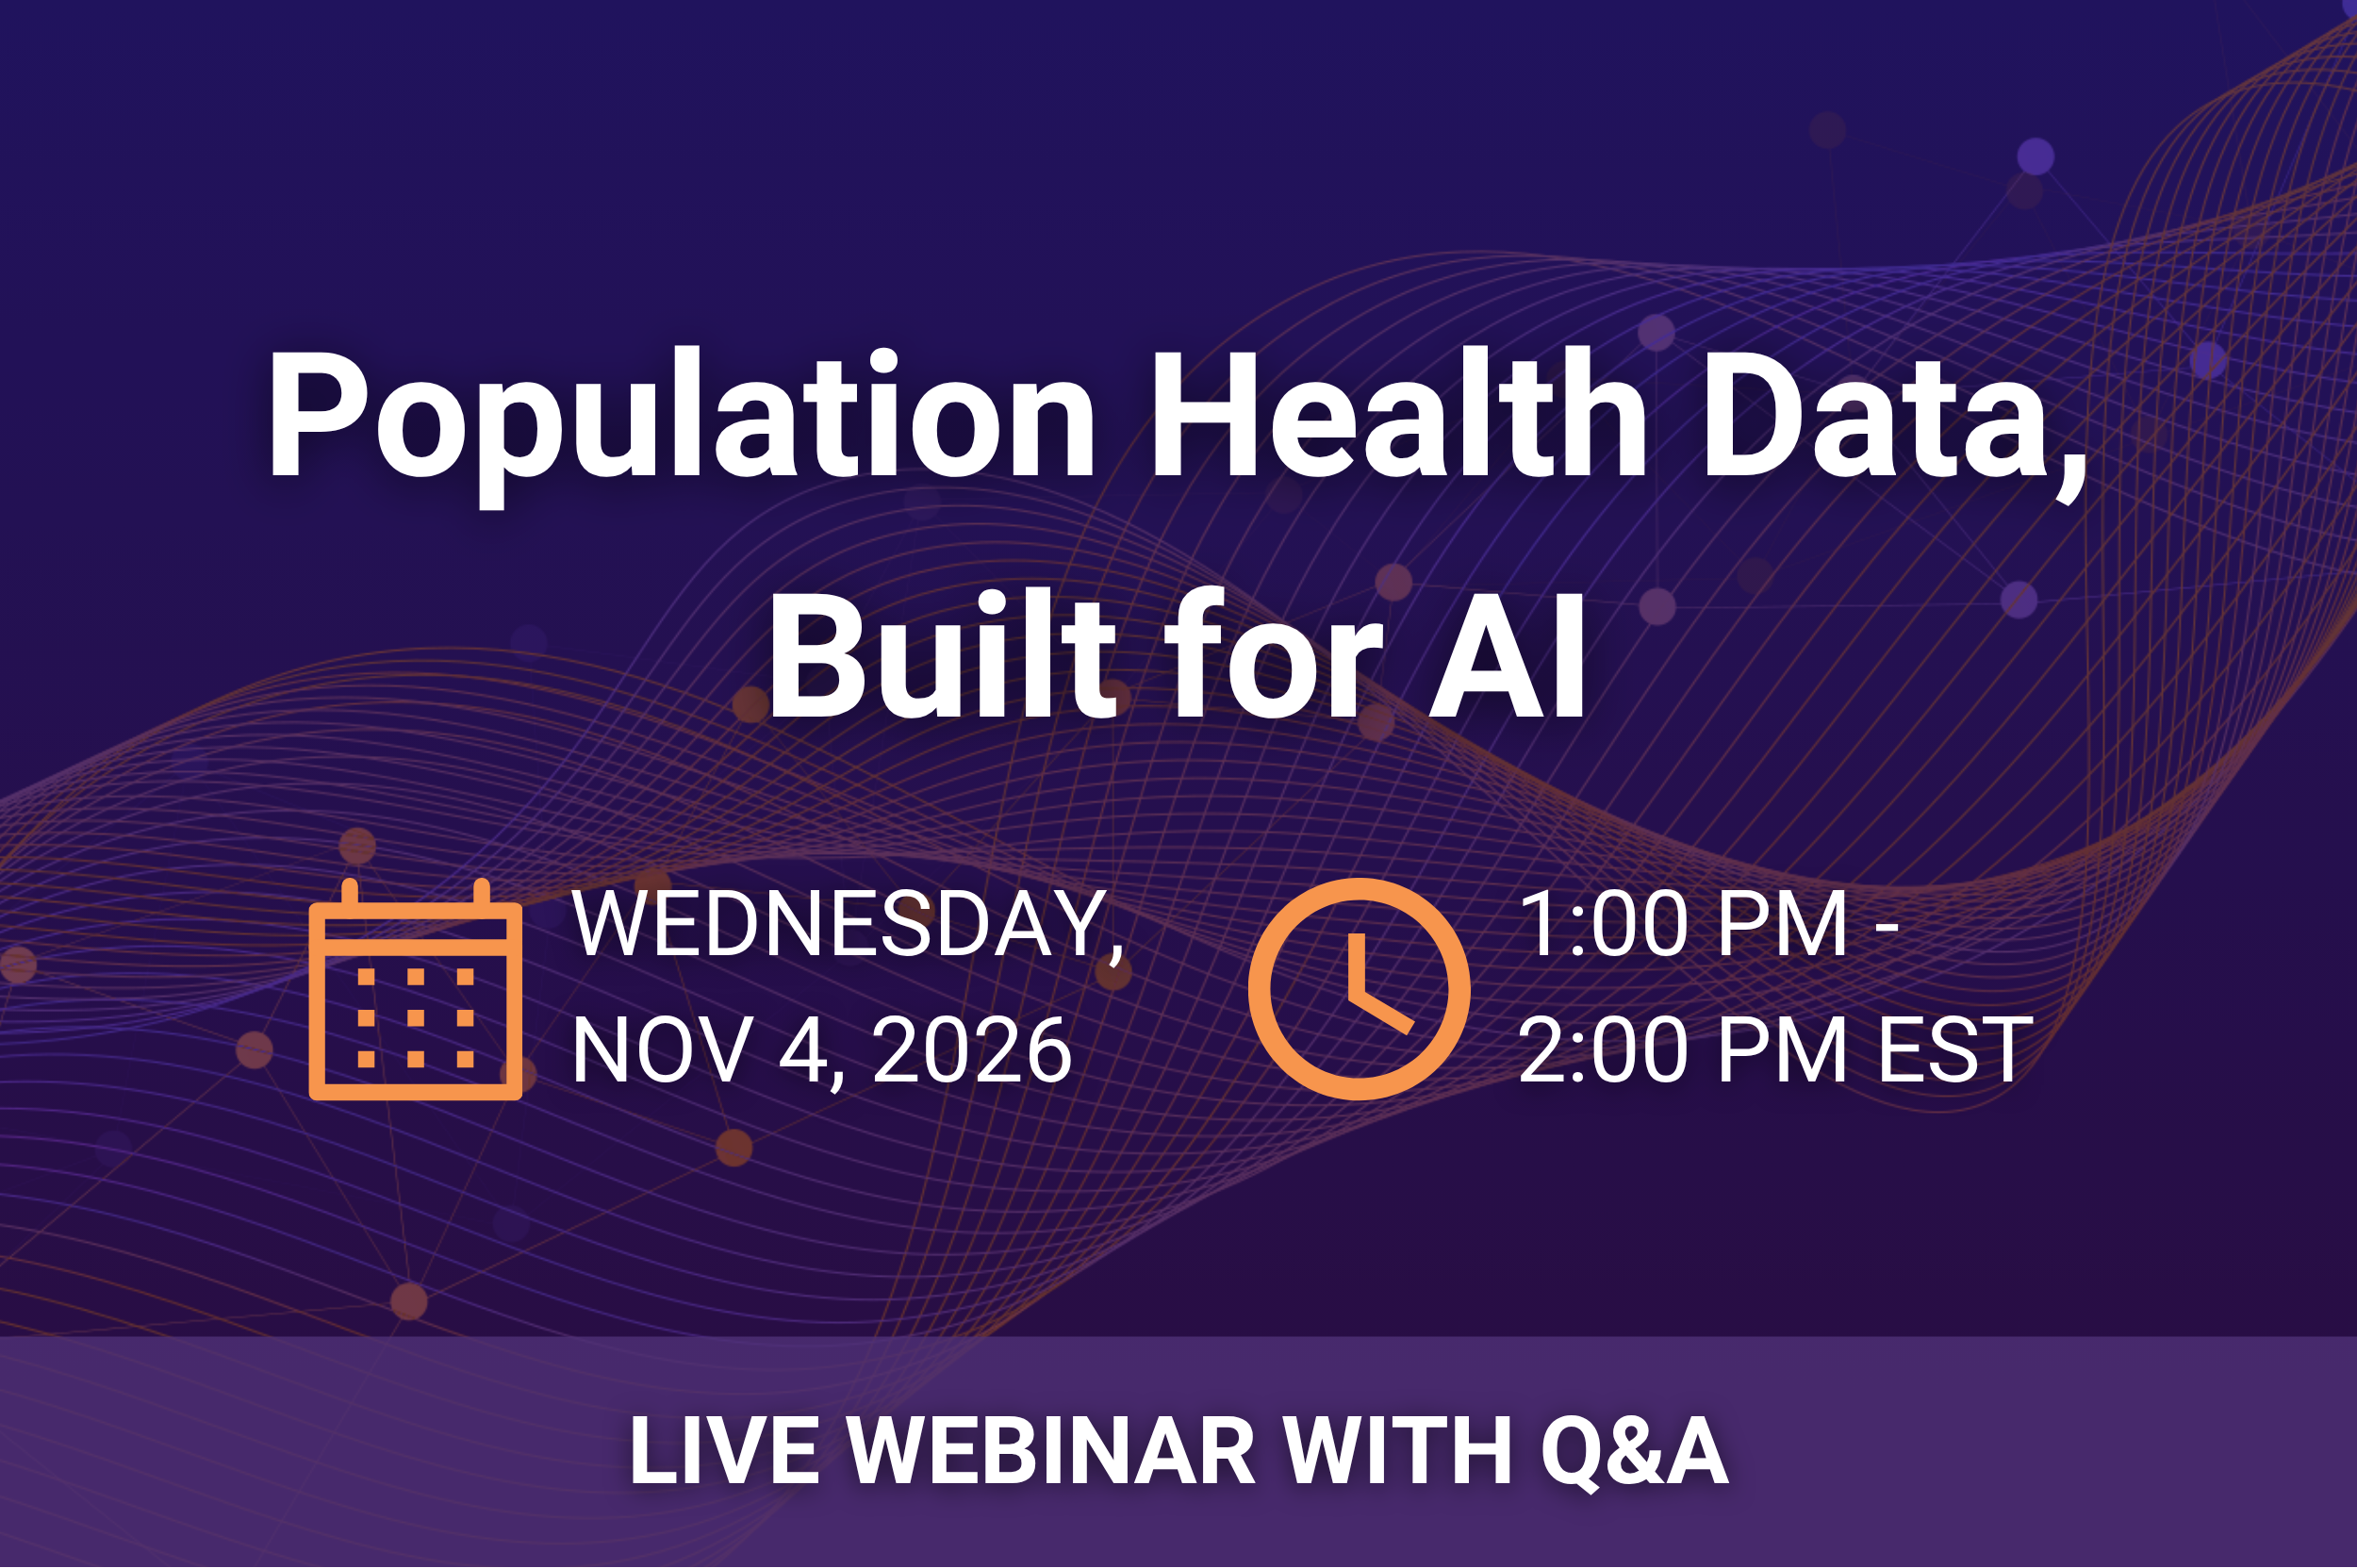
Population Health Data, Built for AI
Join our next PolicyMap Office Hours webinar to explore our new AI-Ready Population Health Data package.
See a live demo of PolicyMap’s population health data inside Snowflake Cortex AI, where plain-language questions get answers grounded in trusted, analysis-ready data, and get a first look at what’s next for data access, including a new MCP server and connectors for Copilot, Claude, and more. Space is limited, so save your seat today!
Register Now |
|
|
|
|
 |
|
 |
|
The CRA Eligibility Criteria dataset has been fully updated for 2026.
The Feeding America Map the Meal Gap dataset has been updated with 2024 data from the 2026 release. A new Price Note indicator shows counties whose food prices were estimated from neighboring counties. This update also replaces 2023 county food insecurity estimate
FEMA Disaster Assistance has been updated to data as of October 2026.
Qualified Census Tracts (QCT) from HUD have been updated to 2027 data.
BLS Local Area Unemployment (LAU) monthly statistics data has been updated with the latest October release, showing August preliminary data and July’s finalized data.
Niche school performance locations and distance to the nearest high-performing school data have been updated to 2026. In this update, we improved how distance is measured. It now starts from where people actually live in each area, using the Census Bureau’s population-weighted centers, rather than from the area’s geographic center.
We are committed to our promise of curated, cleaned, standardized, and always updated data. We’re posting real-time updates on our website, LinkedIn and BlueSky.
|
|
|
|
 |
|
Published Research
Explore scholarly works from students and researchers using PolicyMap.
Built Environment, Community Safety, and Diabetes in the Deep South: A County Level Geospatial Analysis, published in the Journal of Racial and Ethnic Health Disparities
Network analysis of chronic disease diagnosis co-documentation in insurance claims among older Arkansans, published in ScienceDirect
Open PolicyMap Training Sessions
Offered twice a week. Register here.
Level 1: Learning the basics of PolicyMap
Level 2: Learn the Data Loader, Multi-Layer Maps, and other Advanced Features
Open to non-subscribers. Course times rotate weekly. Don’t see a time that works for you?
Contact us.
|
|
|
|
![]() |
|
|
|
|