
PolicyMap Office Hours: A Closer Look at PolicyMap’s Exclusive Data and Indicators

Thank you for joining the latest session in our PolicyMap Office Hours webinar series! In this session, Owen McCarthy, Director of Data Analytics, explores the proprietary data and indicators available only through PolicyMap.
PolicyMap’s portfolio spans millions of indicators across demographics, housing, health, education, income, employment, environment, and more — all structured, normalized, and quality-checked so your team can move directly from data to insight. See the proprietary data and indicators that make PolicyMap’s portfolio uniquely powerful. *Please note: during this session, we referenced “Surgo Ventures” as the provider of the MVI; the organization has since rebranded to Surgo Health.
Whether you’re building models, conducting assessments, or looking to reduce the time spent sourcing and validating data on your own — this session is for you.
PolicyMap’s Exclusive Data & Indicators
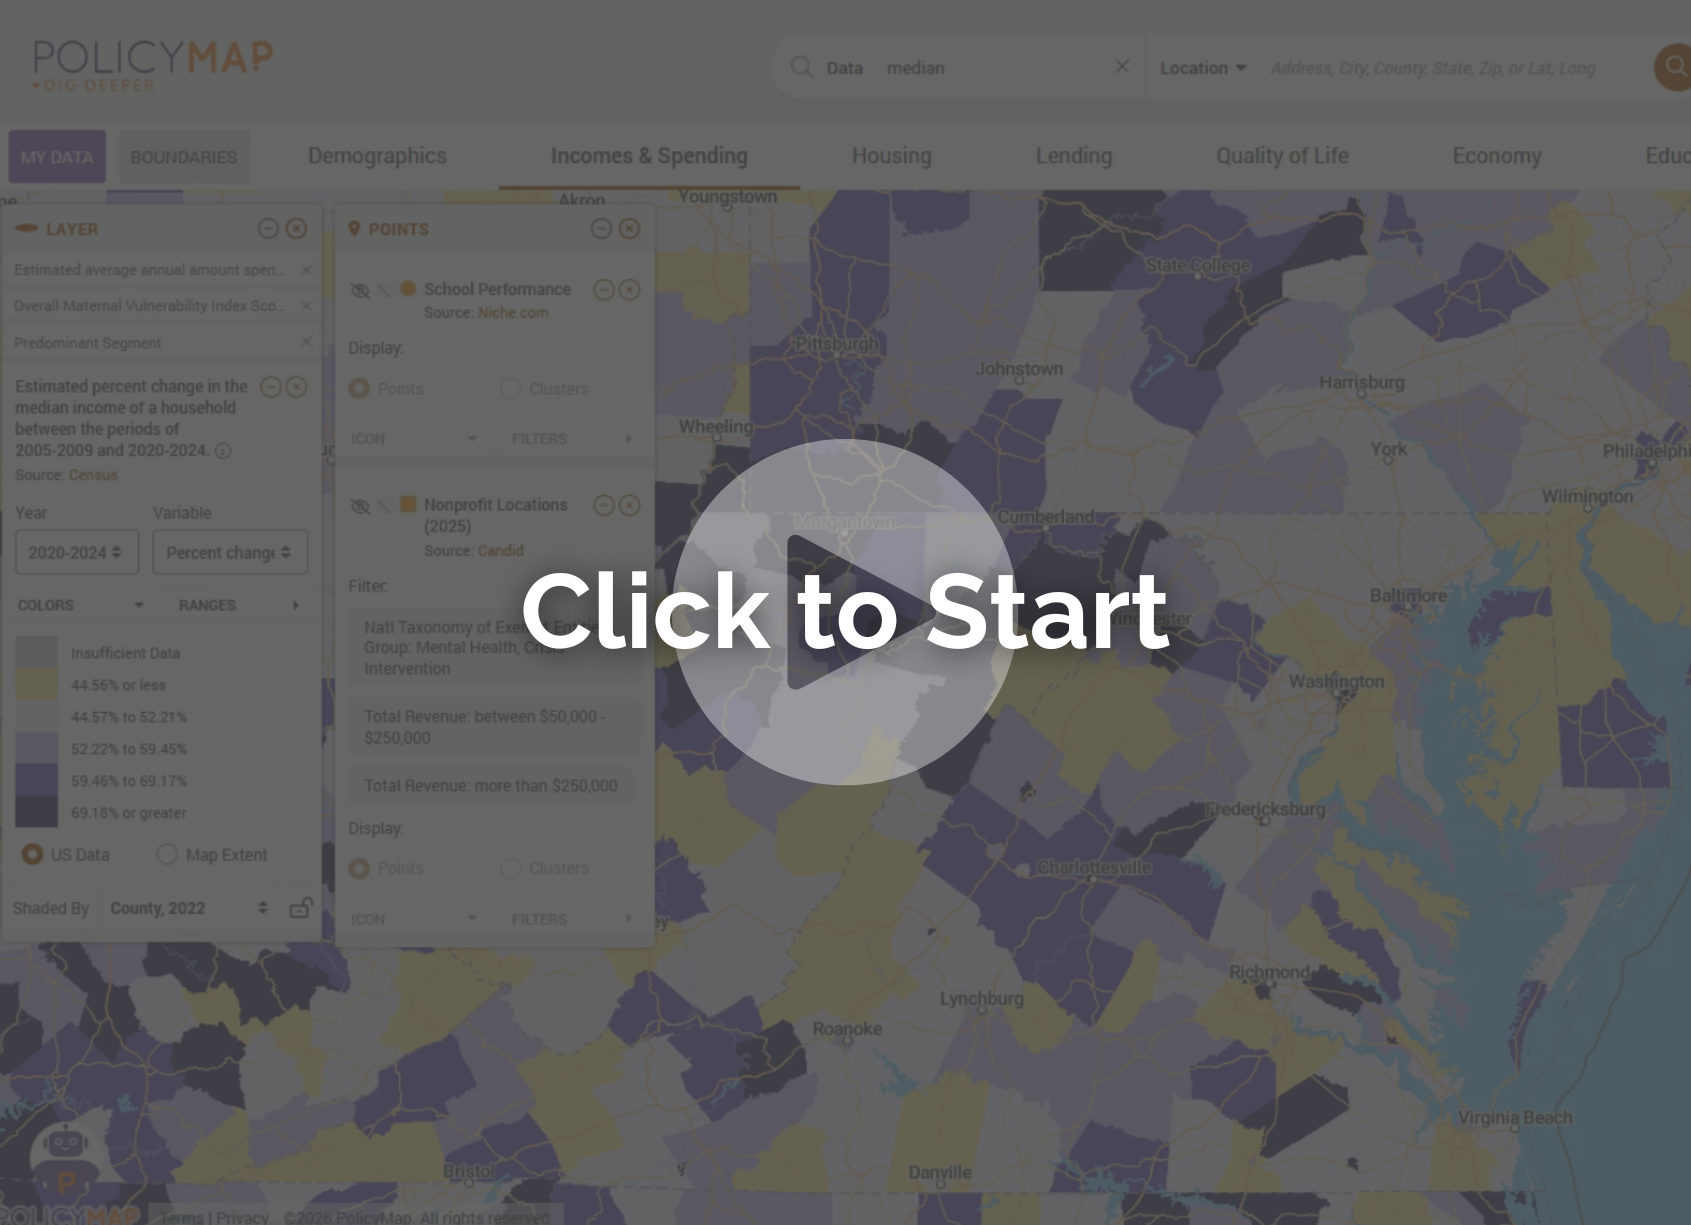
Explore the proprietary data built for analytics, AI, and real-world decisions
Request More Information
Not a PolicyMap user yet? Contact our sales team to learn more about pricing and see a personalized demo of how PolicyMap’s exclusive data and indicators can support your analytics, assessments, and decision-making.