
Internet Access Disparities Highlighted in All-New Maps from PolicyMap
The internet is a necessary component to modern life, from getting news and learning information, to finding jobs, to managing bank accounts. It’s a vital learning tool for students. But as recent Census data shows, some city neighborhoods are severely lacking in internet access, as are rural areas.
Thanks to this new data, PolicyMap has created the first nationwide map of internet access at the neighborhood level. To see a map of your area, you can go to our maps page and search for your city.
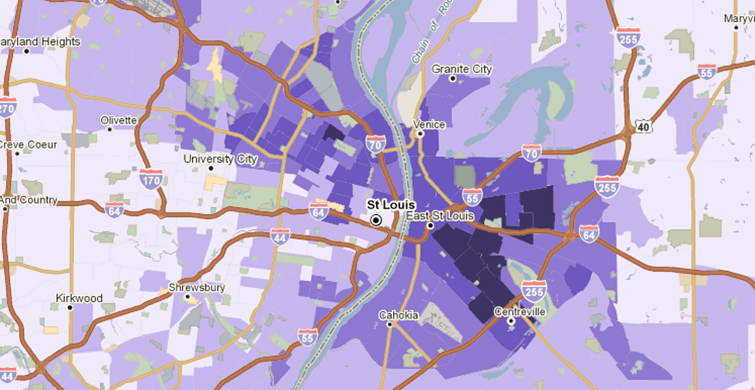
For a quicker look, here are some interactive maps of cities with areas of low internet access. Zoom in and pan around. The darkest purple areas represent census tracts where more than 60% of the population does not have access to the internet. In most of these cities, low levels of internet access occur in low-income and non-white neighborhoods, illustrating the severity of the digital equity gap.
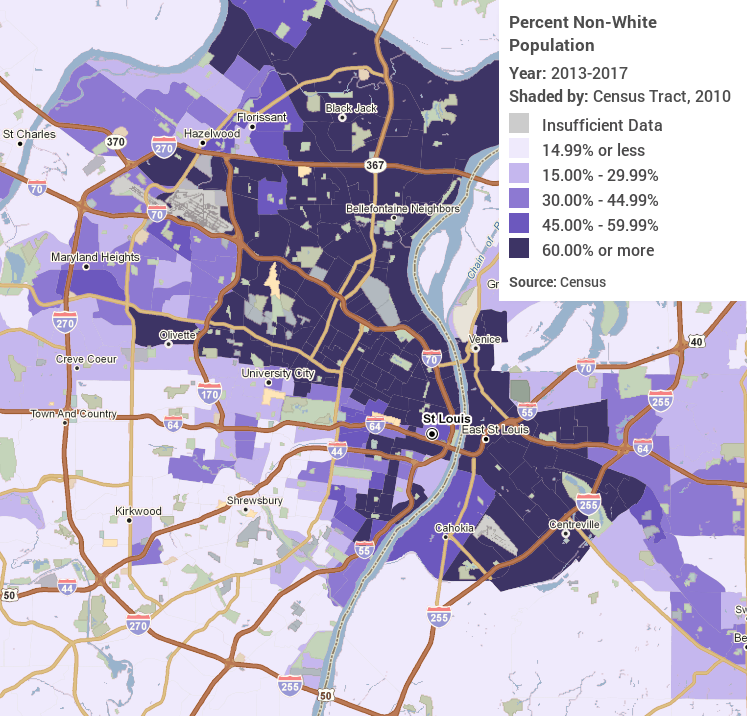
St. Louis is a good example, as the city is heavily segregated between minority neighborhoods in the north and white neighborhoods in the south.
For reference, here is a map of the non-white population in St. Louis:
New York:
Los Angeles:
Chicago:
Houston:
Philadelphia:
Phoenix:
Washington, DC:
Miami:
Dallas:
If your city isn’t here, just go to our maps page and put in your location. There, you can find thousands of other indicators, including other indicators about internet access in the Quality of Life menu.
Want to know more about PolicyMap or include these maps on your website? Learn more or get in touch.