
What Changed in the 2027 Opportunity Zones, State by State

Key Takeaways
- There are 6,576 Opportunity Zones for 2027, down from 8,764 in 2018, a drop of about 25%.
- 55% of 2027 Opportunity Zones are new. 3,596 census tracts that weren’t zones in 2018 are zones now.
- Fewer tracts qualify. 25,462 tracts were eligible to become 2027 Opportunity Zones, compared with more than 41,000 in 2018, after a stricter income test and the end of eligibility for tracts that only bordered a low-income tract.
- Puerto Rico drives much of the decline, falling from 863 Opportunity Zones to 178. Excluding Puerto Rico, the number of zones fell about 19%.
- Rural tracts make up 39% of 2027 Opportunity Zones, though only 33% of eligible tracts are rural. For investments made after 2026, funds in rural zones get a bigger break: 30% of deferred gains become tax-free after five years, versus 10% elsewhere.
Data
Opportunity Zones (QOZ)
Source
CDFI Fund and U.S. Department of the Treasury
Find on PolicyMap
- Federal Guidelines
- Additional CDFI Fund Programs
- Additional CDFI Fund Programs
National Opportunity Zone totals, 2018 vs. 2027
More than half of the 2027 Opportunity Zones are new, and there are a quarter fewer zones than in 2018. The One, Big, Beautiful Bill Act, signed July 4, 2025, made Opportunity Zones permanent, with a new round every ten years. The 2027 zones run from January 1, 2027 through December 31, 2036 (Rev. Proc. 2026-14).
| Tracts | |
|---|---|
| 2018 Opportunity Zones | 8,764 |
| 2027 Opportunity Zones | 6,576 |
| Tracts eligible to be 2027 zones | 25,462 |
| New in 2027 (not a zone in 2018) | 3,596 (55% of 2027 zones) |
| Designated in both rounds | 2,980 |
All counts cover the 50 states, DC, Puerto Rico, and the four smaller territories, and match Treasury’s national totals. Because 2018 zones use 2010 census tract boundaries and 2027 zones use 2020 tract boundaries, comparisons between the two rounds are close approximations.
What changed for Opportunity Zones in 2027
Most of the 2027 map is new
For investors and CDFIs, the markets they studied in 2018 are a weak guide to where they can invest now. The two maps also overlap in time: 2018 zones stay in effect until December 31, 2028, and Puerto Rico’s until December 31, 2027 (Rev. Proc. 2026-14, section 2.02).
The count fell because fewer tracts qualify, not because states held back
States can designate up to 25% of their eligible tracts, rounded up, or 25 tracts if they have fewer than 100 eligible (Rev. Proc. 2026-14, section 2.02(3)(c)). Nearly every state designated exactly 25% in 2027, and the CDFI Fund notes every state used its full allotment in 2018 too.
What shrank is the pool of tracts that qualify. Under the new test, a tract qualifies if its median family income is at or below 70% of the area median (down from 80%), or if its poverty rate is at least 20% and its income is no higher than 125% of the area median. A tract also can no longer qualify just by bordering a low-income tract. In 2018, over 41,000 tracts qualified, including 9,453 that qualified only by bordering one. For 2027, 25,462 qualify.
Vermont (24 zones), Wyoming (20), and the four smaller territories (73 zones, all rural) designated every eligible tract they had. Most territory zones carried over from 2018.
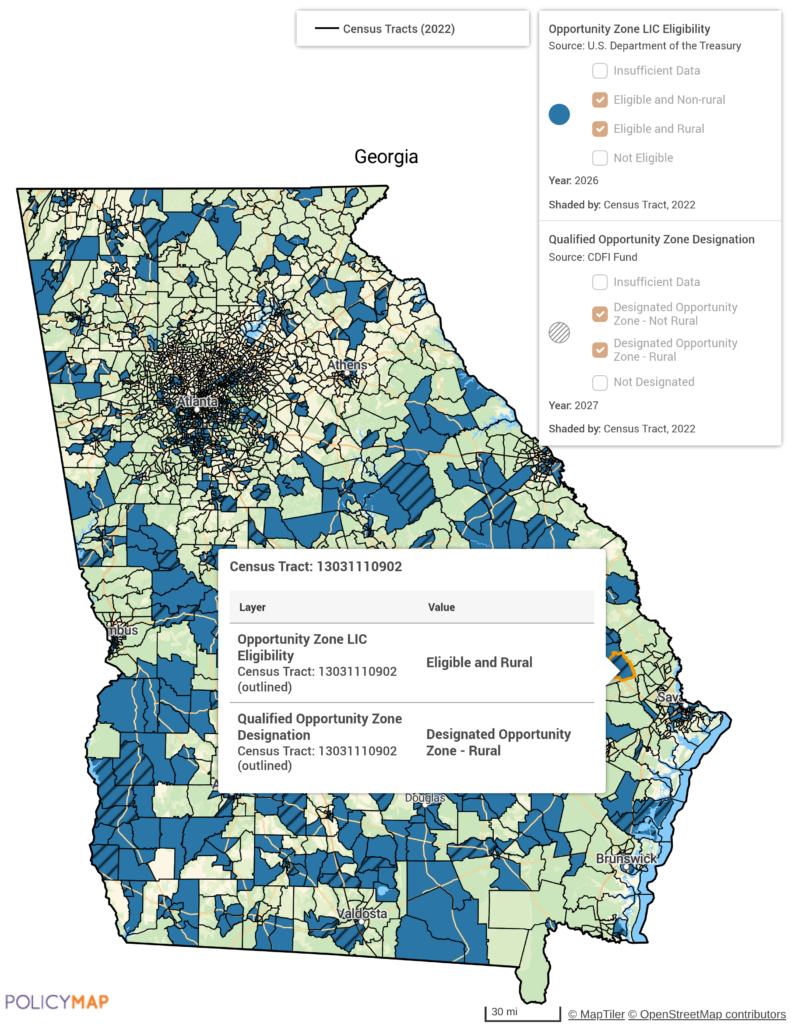
Georgia’s 2027 Opportunity Zones (hatched) and the census tracts eligible to become zones (blue). States could designate up to 25% of their eligible tracts. Source: PolicyMap, U.S. Treasury, CDFI Fund.
Most zones that weren’t redesignated still qualify
Of the 2018 zones not redesignated, 44% no longer meet the new income test. Eligibility for 2027 is based on the Census Bureau’s 2020–2024 American Community Survey, while the 2018 round used 2011–2015 data. So some of these tracts dropped out because the rules got stricter, and some because incomes rose or poverty fell over the decade. The other 56% still qualify, but governors picked other tracts. (These shares cover the states, DC, and Puerto Rico.)
- States that passed over zones that still qualify: in Georgia, only 21% of the zones not redesignated lost eligibility, and in Illinois, 22%. Both also rebuilt their maps almost entirely.
- States where most of these zones lost eligibility: Vermont and Wyoming (100%), Delaware (89%), Alaska (88%), Idaho (83%).
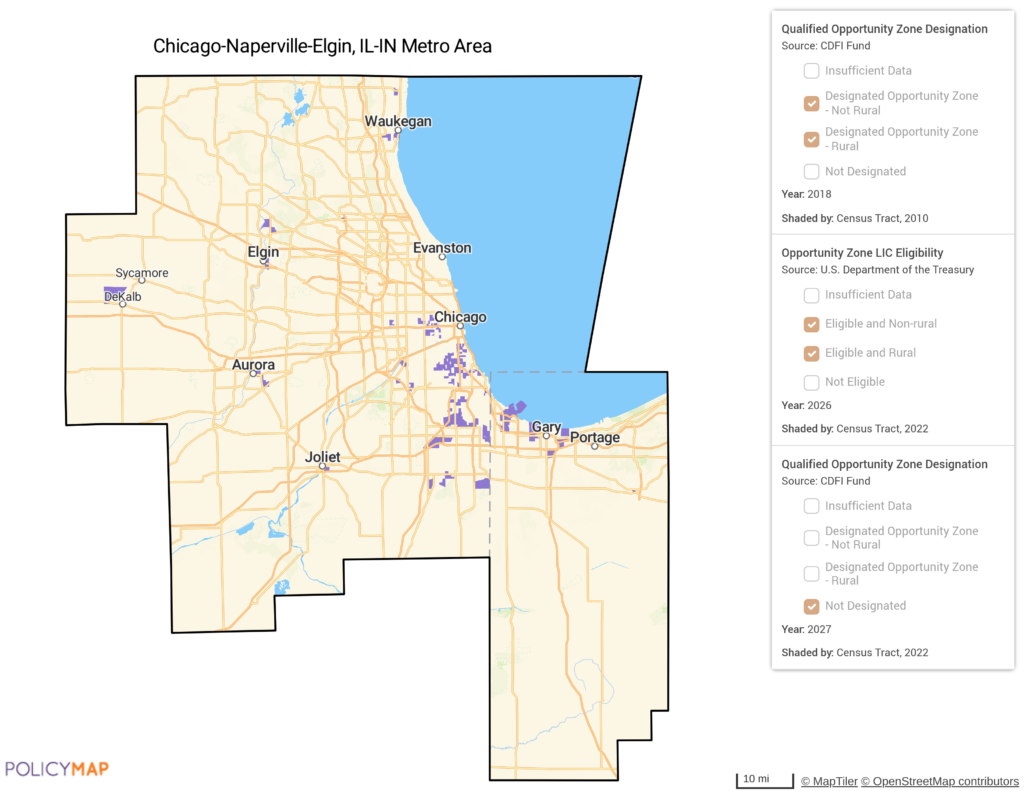
Chicago-area tracts that were 2018 Opportunity Zones, still qualify, and were not redesignated for 2027. Statewide, only 22% of Illinois zones that were dropped lost eligibility. Source: PolicyMap, CDFI Fund, U.S. Treasury.
Puerto Rico drives much of the decline
Puerto Rico went from 863 zones (nearly the whole island) to 178. In 2018, section 41115 of the Bipartisan Budget Act made every low-income tract in Puerto Rico a zone automatically (Rev. Proc. 2026-14, section 2.02(2)(b)). The 2025 law repealed that rule, so Puerto Rico now follows the same 25% cap as the states: 178 is exactly 25% of its 712 eligible tracts.
Only 1 of its 2027 zones is new, and three-quarters of its zones not redesignated still qualify. Its 2018 zones stay in effect through the end of 2027. Without Puerto Rico, zones fell from 7,901 to 6,398, about 19%.
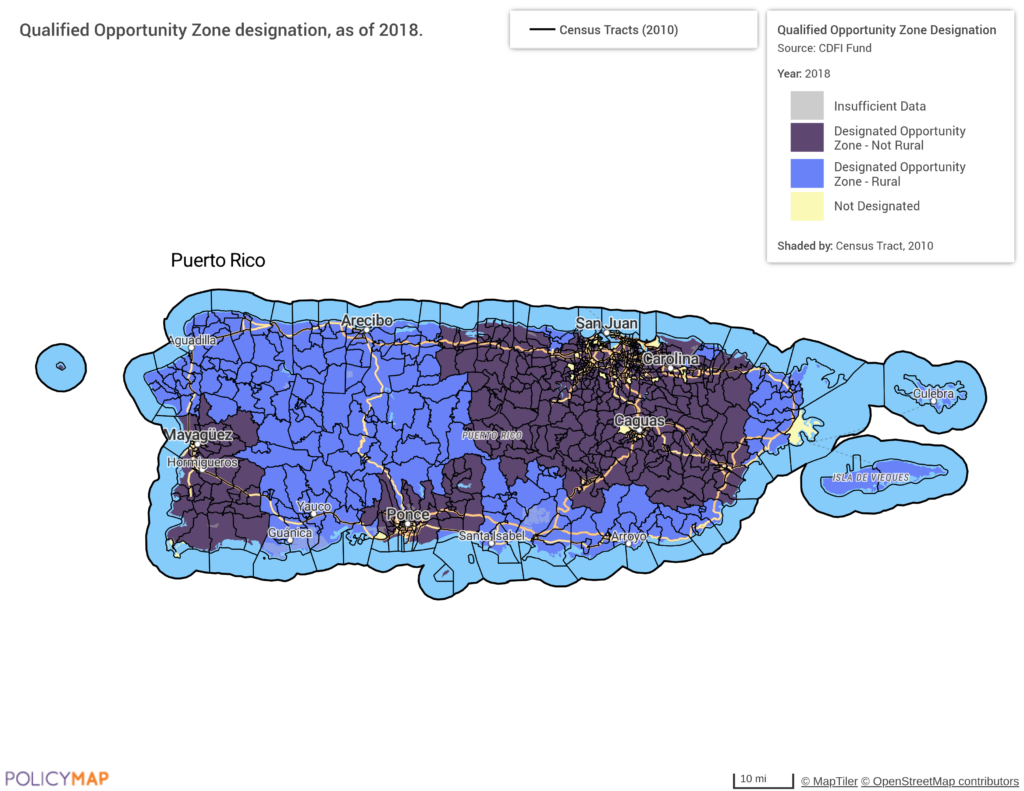
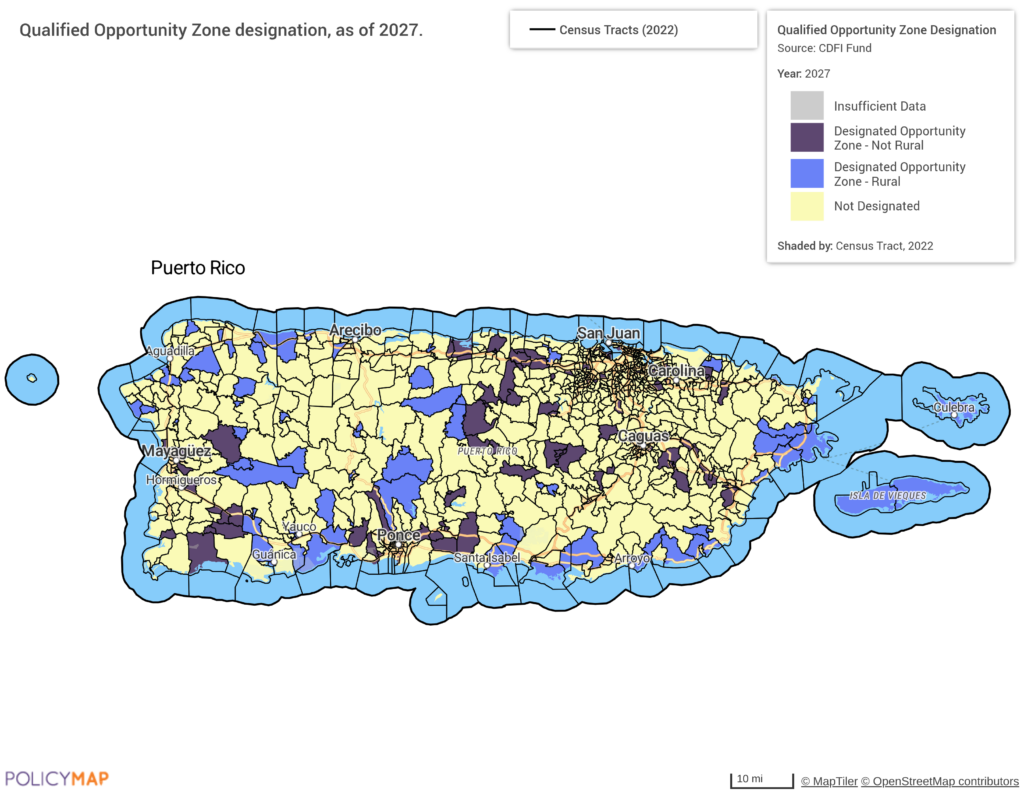
Puerto Rico’s Opportunity Zones in 2018 (left) and 2027 (right). The island went from 863 zones to 178 after the 2025 law ended automatic designation. Source: PolicyMap, CDFI Fund (left image link | right image link).
The big states added the most new zones
Texas 405, California 387, Florida 218, New York 213, Illinois 164.
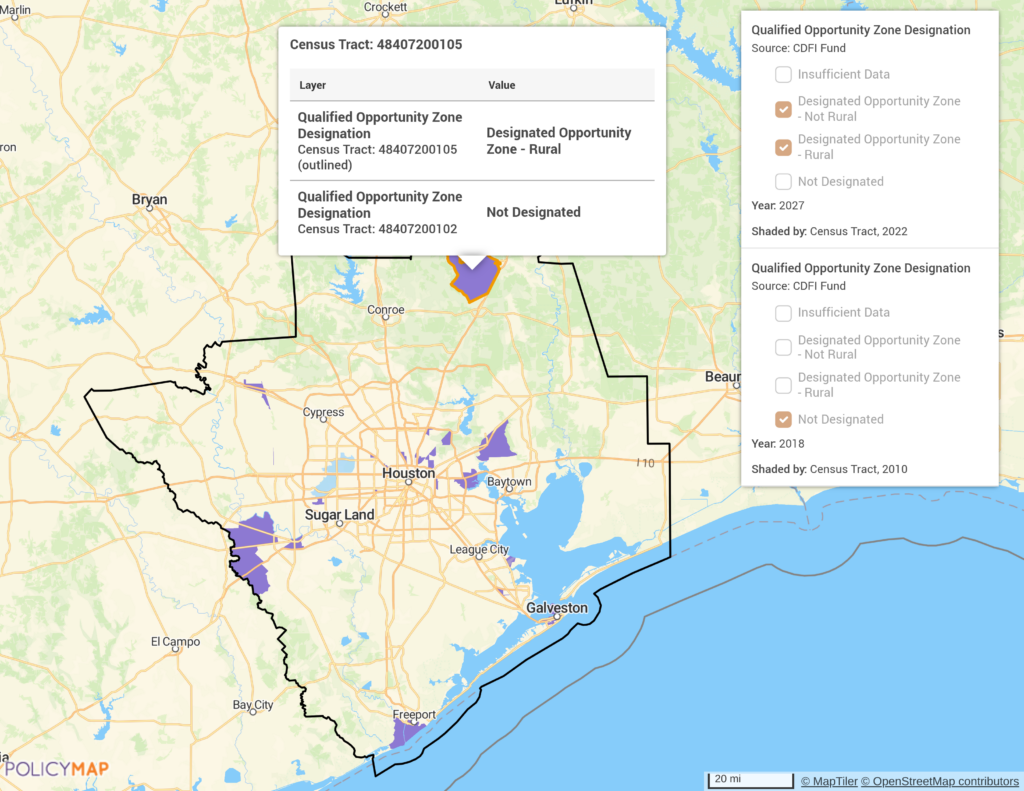
New Opportunity Zones in the Houston area: tracts designated for 2027 that weren’t zones in 2018. Texas added 405 new zones statewide, the most of any state. Source: PolicyMap, CDFI Fund.
Some states rebuilt their maps almost entirely
New zones make up 80% of Idaho’s 2027 zones and 75% of New Mexico’s. Illinois, Maine, Georgia, and Texas are at 67 to 68%. At the other end are South Dakota (24%) and Delaware (28%). Only Louisiana, Mississippi, and New Mexico gained zones overall.
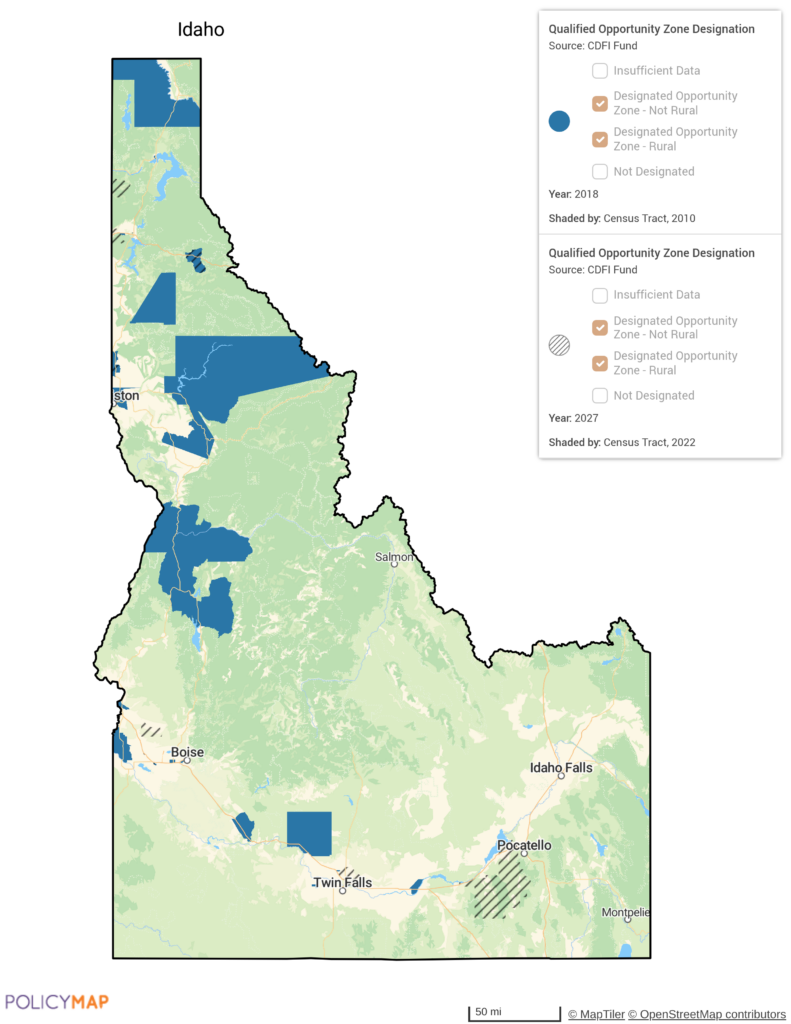
Idaho’s Opportunity Zones in 2018 (blue) and 2027 (hatched). 80% of Idaho’s 2027 zones are new, the highest share of any state. Source: PolicyMap, CDFI Fund.
Governors leaned rural, even though the overall share barely moved
Rural tracts were 38% of zones in 2018 and 39% in 2027. Both rounds use the same 2020 Census rural definition: Treasury assigned rural status to 2018 zones after the fact in Notice 2025-50, which lists 3,309 rural 2018 zones.
But only 33% of eligible tracts are rural, so states picked rural tracts more often than the pool would predict. The biggest tilts:
| State | Rural share of eligible tracts | Rural share of 2027 zones |
|---|---|---|
| Nebraska | 25% | 43% |
| Kansas | 36% | 51% |
| Iowa | 33% | 48% |
| Nevada | 13% | 29% |
| New York | 18% | 29% |
Rural status now matters more for investors. Since July 4, 2025, an investor renovating an existing building in a rural zone needs to spend only half as much on improvements to qualify (Notice 2025-50). For investments made after 2026, funds that invest in rural zones also get a bigger tax break: after five years, 30% of the capital gain they deferred becomes tax-free, versus 10% elsewhere (Pub. L. 119-21, section 70421(c)).
New zones aren’t always poorer than the zones they replaced
Median poverty rate of the tracts in each group, from the Census Bureau’s 2020–2024 American Community Survey:
| State | New zones | Not redesignated | Zones in both rounds |
|---|---|---|---|
| Texas | 25.6% | 18.0% | 26.4% |
| Ohio | 24.8% | 21.2% | 31.8% |
| Georgia | 21.9% | 25.8% | 29.4% |
In Texas and Ohio, the new zones are poorer than the ones not redesignated; in Georgia it’s the reverse. In all three, zones designated in both rounds are the poorest. These are three states, not a national finding.
See the 2027 Opportunity Zones in your market
PolicyMap maps 2018 and 2027 Opportunity Zones and Opportunity Zone eligibility at the census tract level, alongside data on income, housing, health, and more. See where zones fall in your market, compare them with the indicators that matter to your work, and use our AI tools to get answers faster.
Request More Information
Contact PolicyMap to learn more about our data, mapping, and AI tools, or to schedule a personalized demo.