
Events
Calendar of Events
|
Sunday
|
Monday
|
Tuesday
|
Wednesday
|
Thursday
|
Friday
|
Saturday
|
|---|---|---|---|---|---|---|
|
0 events,
|
0 events,
|
1 event,
-
This overview will cover: basic user interface (searching for locations, loading datasets, saving & printing), unique custom functionality (creating custom boundaries, editing ranges, customizing colors, etc), and highlighting specific datasets. |
1 event,
-
Learn how to quickly upload a point (address) dataset to share or for internal study, download data for for states or the nation, and use the Multi-Layer Maps tool to overlay up to 5 layers of data. |
0 events,
|
0 events,
|
0 events,
|
|
0 events,
|
0 events,
|
0 events,
|
1 event,
-
Learn how to quickly upload a point (address) dataset to share or for internal study, download data for for states or the nation, and use the Multi-Layer Maps tool to overlay up to 5 layers of data. |
1 event,
-
This overview will cover: basic user interface (searching for locations, loading datasets, saving & printing), unique custom functionality (creating custom boundaries, editing ranges, customizing colors, etc), and highlighting specific datasets. |
0 events,
|
0 events,
|
|
0 events,
|
0 events,
|
1 event,
-
This overview will cover: basic user interface (searching for locations, loading datasets, saving & printing), unique custom functionality (creating custom boundaries, editing ranges, customizing colors, etc), and highlighting specific datasets. |
1 event,
-
Learn how to quickly upload a point (address) dataset to share or for internal study, download data for for states or the nation, and use the Multi-Layer Maps tool to overlay up to 5 layers of data. |
0 events,
|
0 events,
|
0 events,
|
|
0 events,
|
0 events,
|
0 events,
|
1 event,
-
Learn how to quickly upload a point (address) dataset to share or for internal study, download data for for states or the nation, and use the Multi-Layer Maps tool to overlay up to 5 layers of data. |
1 event,
-
This overview will cover: basic user interface (searching for locations, loading datasets, saving & printing), unique custom functionality (creating custom boundaries, editing ranges, customizing colors, etc), and highlighting specific datasets. |
0 events,
|
0 events,
|
|
0 events,
|
0 events,
|
1 event,
-
This overview will cover: basic user interface (searching for locations, loading datasets, saving & printing), unique custom functionality (creating custom boundaries, editing ranges, customizing colors, etc), and highlighting specific datasets. |
2 events,
-
Learn how to quickly upload a point (address) dataset to share or for internal study, download data for for states or the nation, and use the Multi-Layer Maps tool to overlay up to 5 layers of data.
-
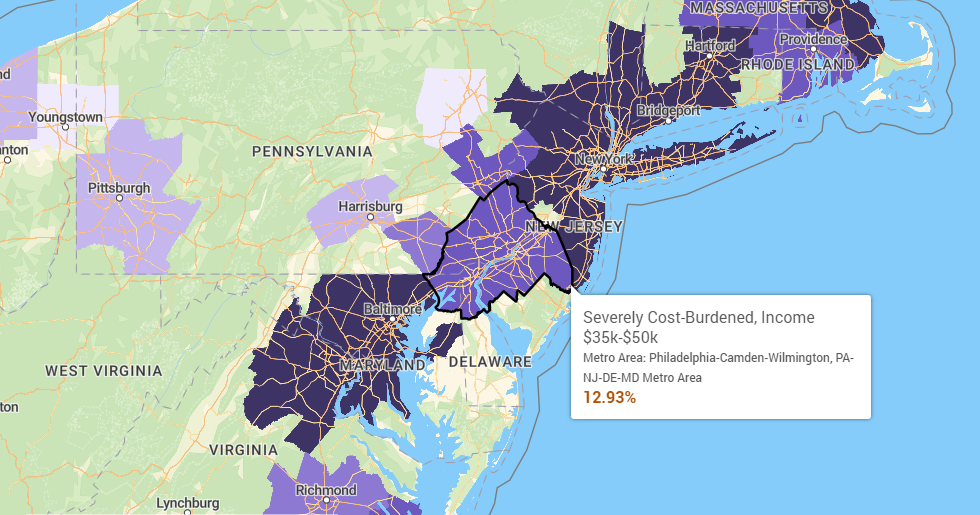
PolicyMap is excited to support the release of the ULI Terwilliger Center’s 2022 Home Attainability Index! The ULI Terwilliger Center’s Home Attainability Index, which launched in 2020, provides practitioners with an easily accessible resource that can set a data-informed foundation for regional discussions of housing needs and solutions. In this webinar, Mike Spotts, author of... |
0 events,
|
0 events,
|
0 events,
|
|
0 events,
|
0 events,
|
0 events,
|
1 event,
-
Learn how to quickly upload a point (address) dataset to share or for internal study, download data for for states or the nation, and use the Multi-Layer Maps tool to overlay up to 5 layers of data. |
1 event,
-
This overview will cover: basic user interface (searching for locations, loading datasets, saving & printing), unique custom functionality (creating custom boundaries, editing ranges, customizing colors, etc), and highlighting specific datasets. |
0 events,
|
0 events,
|