
Mapping & Analytics
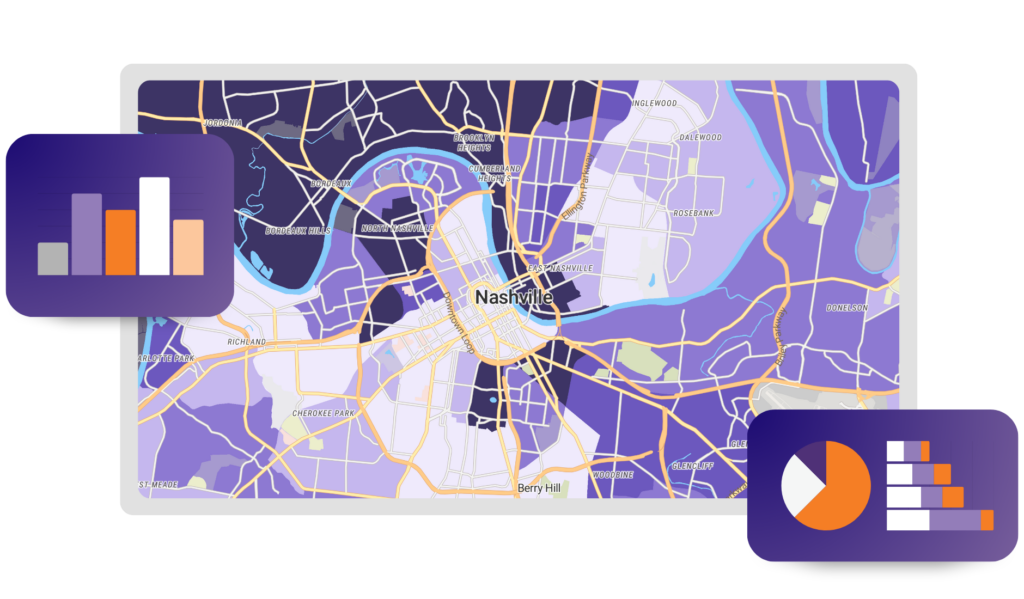
Make sense of millions of data indicators — PolicyMap’s mapping and analytics platform lets you explore, visualize and analyze – all in one place. Whether you are identifying areas of need, evaluating opportunities, or supporting decisions, you can move from question to answer quickly with tools designed to be both powerful and easy to use.
SEE WHERE DATA COMES TOGETHER
Multi-Layer Maps
Zero in on the right locations — overlay up to five data layers and apply simple conditions to find where your most important factors align. Multi-Layer Maps make it easy to answer real questions about need, risk, and opportunity. Explore detailed data across large areas with expanded zoom levels, keeping your insights clear and consistent. Focus your view by clipping maps to a state, neighborhood, or custom region you define. When you are ready to go further, download your results as clean, ready-to-use data for reporting, modeling, or sharing.
TURN DATA INTO CLEAR, SHAREABLE INSIGHT
Dashboards
Get the full picture of any place. Detailed dashboards and reports pull together trusted data across demographics, housing, health, and more, for any geography you choose or custom region you create, with all the calculations done for you. Customize what you see by choosing sections, reordering content, and switching between charts, tables, and other visuals. Add AI-generated summaries to highlight key takeaways and make your findings easier to understand. Export full reports or individual sections as PDFs, images, or data files, ready to share or use in your workflow.
DEFINE THE AREAS THAT MATTER TO YOU
Custom Regions
Your work doesn’t fit neatly into standard geographies — so build the boundaries that do. Draw shapes freehand, build regions by combining existing areas like zip codes or census tracts, or set a radius around any address or point. Use these custom regions to run reports, explore data layers, or download results tailored to your exact area of interest. Save and manage your regions in one place, with options to edit, label, and control how they appear on the map. Share regions with colleagues to support consistent analysis and collaboration across your team.
CONNECT EVERY ADDRESS TO DEEPER INSIGHT
Geocoder
Turn any address into precise, trusted location data enriched with millions of socio-economic indicators. Upload your own addresses into PolicyMap to map locations, run analysis, and connect them to the full platform. Review match rates, fix or update any unmatched records, and refine your dataset directly in the platform. Align every point to standard geographies like census tracts and zip codes for reliable comparisons and reporting.
GET THE DATA BEHIND THE MAP
Export Data
Download the data you need in a few simple steps and take it into your own tools. Choose from aggregated layers, point datasets, or combine both to connect addresses with the data around them. Select any location, from the entire country to a custom region you created, and pick the geography that fits your analysis. Files are delivered in clean CSV formats with clear metadata, so you can understand and use the data right away. Whether you are building models, reports, or dashboards, Data Download makes it easy to move from map to workflow.
ADD CONTEXT RIGHT ON THE MAP
Annotations
Add your own notes and visuals to highlight what matters in your analysis. Drop markers, write text, and draw shapes like lines, circles, and polygons to call out key locations and patterns. Customize colors, sizes, and styles so your map clearly tells the story you want to share. Edit or update annotations at any time as your work evolves. When you save or share a map, your annotations stay with it, making your insights easy for others to understand.
Ready to see PolicyMap in action?
Schedule a demo to explore how PolicyMap can support your work with mapping, analysis, and data you can trust.