
Two Decades of Change: What the Latest Census ACS Data Reveals About Long-Term Trends in Communities

Key Takeaways
- 20 years, now comparable: For the first time, ACS data spans 4 aligned five-year periods (2005–2024) with new 10-year change metrics
- Sun Belt rises, Rust Belt retreats: States like Florida, Texas, and Arizona led growth, while parts of the Midwest and Northeast saw long-term population decline
- Poverty is persistent, not cyclical: Nearly 10% of counties sustained 20%+ poverty across all periods; ~1 in 3 experienced at least one high-poverty stretch
- The South bears a disproportionate burden: 23.5% of residents live in persistently high-poverty counties vs. 16% nationally, where costs compound
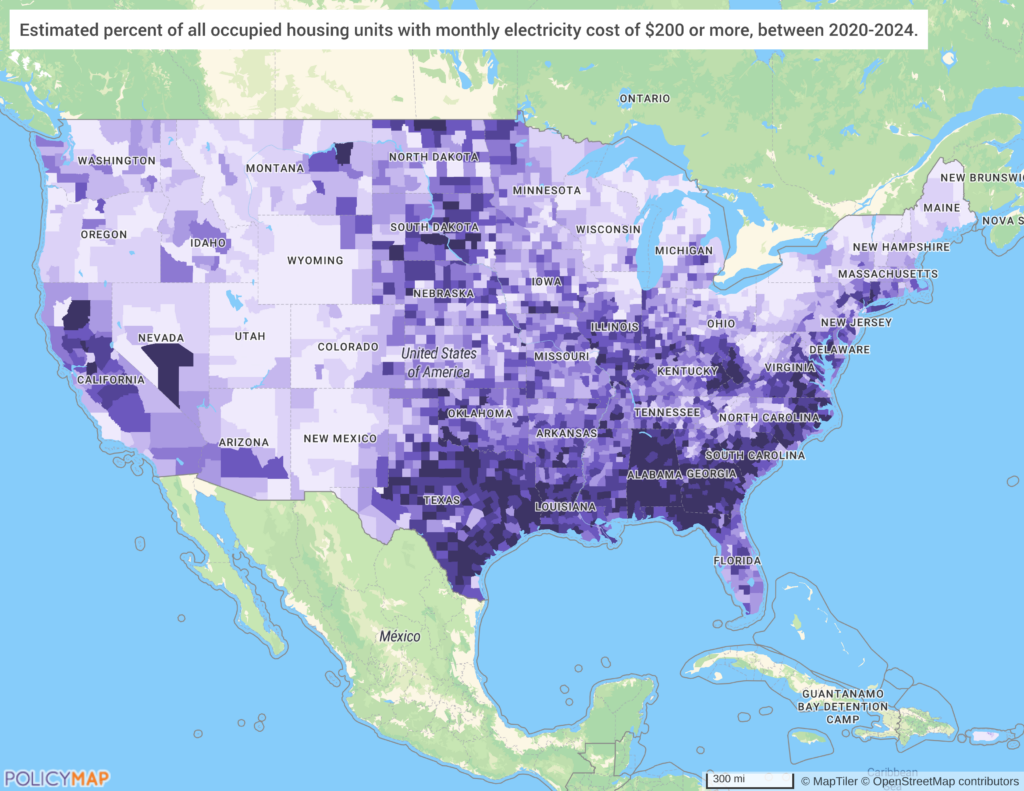
- Rent and utilities drive the squeeze: Rents rose in 20% of counties, and in some areas 50%+ of households pay $200+ per month for electricity
The U.S. Census Bureau’s American Community Survey (ACS) celebrates its 20th anniversary. This release is the first to include four comparable 5-year periods spanning two decades: 2005-2009, 2010-2014, 2015-2019, and 2020-2024. PolicyMap added new 10-year percent change indicators to make it easier to compare the earliest and most recent data. From demographics and community composition to housing costs and family characteristics, new indicators added to PolicyMap from this release include dependent age population, language spoken at home, working families with young children, electricity costs, and median income by household size, alongside two new Census population tables for Black or African American ancestry and White ancestry.
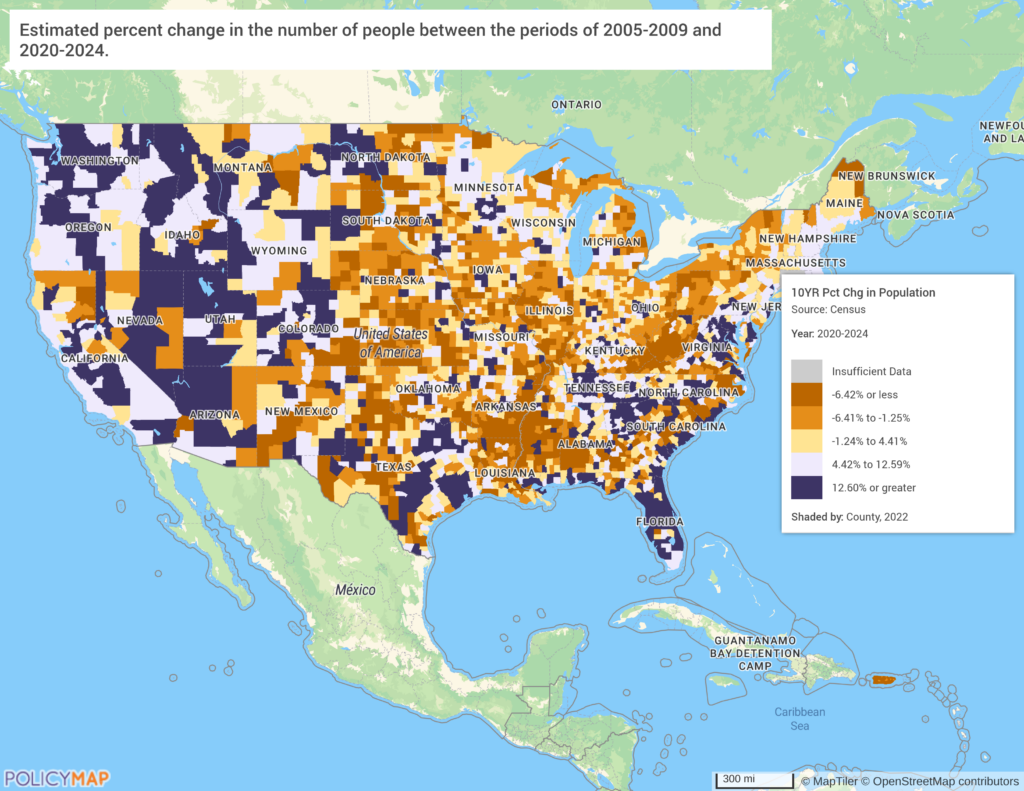
The latest ACS data makes it possible to see how the population has shifted across the country over the past two decades. The 10-year percent change in population reveals a clear pattern: strong growth concentrated in the Sun Belt, with Florida, Texas, Arizona, Nevada, Utah, and the Carolinas and Tennessee leading the way, alongside continued gains across the Mountain West and Pacific Northwest, including Idaho, Colorado, Oregon, and Washington. Meanwhile, parts of the Midwest and Northeast continue to see decline, reflecting longer-term trends in migration and population growth.
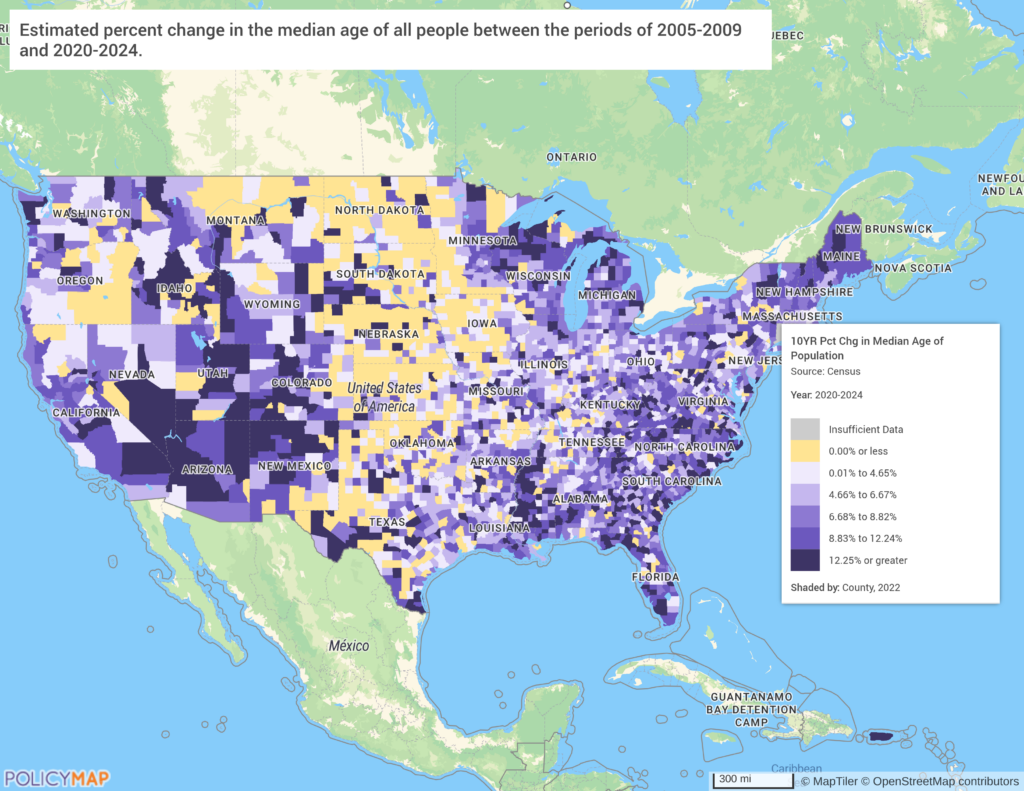
The U.S. population is aging steadily, and the 10-year percent change in median age makes that shift visible at the local level. Recent data reveal a population that is older, longer-living, and gradually more balanced between men and women at later ages. Some communities have aged significantly faster than others over the past two decades, shaped by declining fertility and the aging of the baby boomer generation.
Systemic and Sustained Poverty Over Time
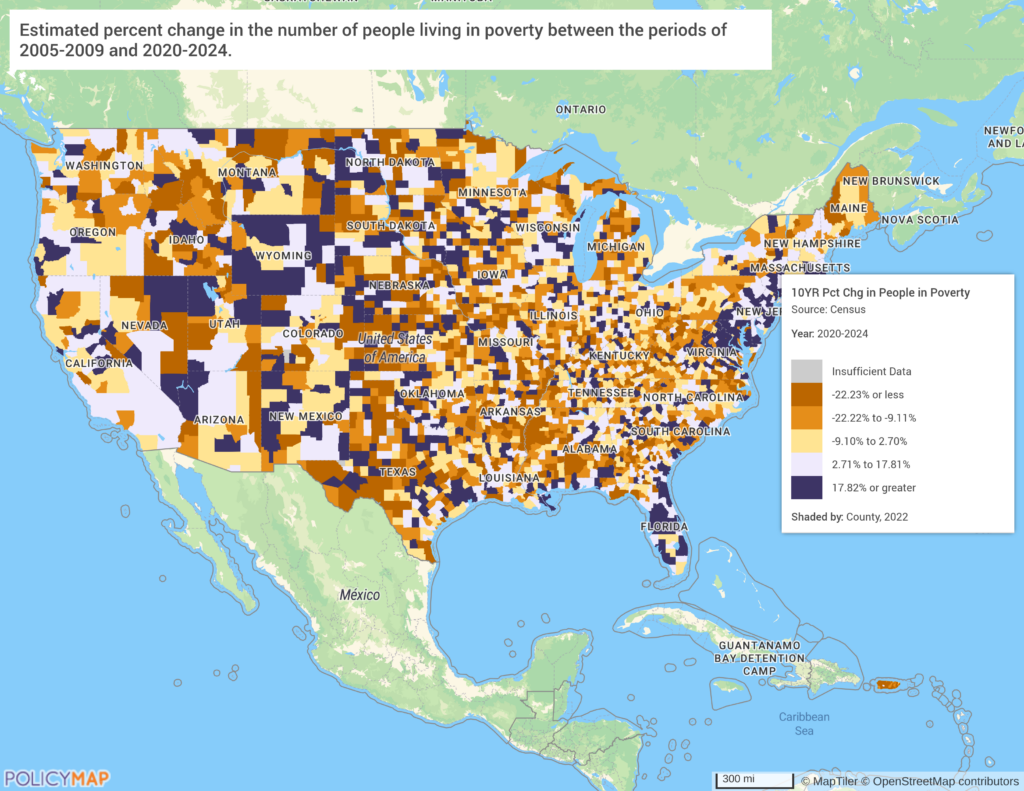
Poverty in America isn’t just a snapshot in time for many communities; it’s a fixture. New data from the ACS shows that nearly 10% of U.S. counties, concentrated heavily in the South, maintained poverty rates of 20% or higher across all four measured periods between 2005 and 2024. These aren’t communities experiencing a rough patch; they’re places where high poverty has been the consistent reality for two decades.
Zooming out, about a third of all U.S. counties experienced at least one five-year stretch of high poverty over that span, and in the South, that figure climbs to more than half of all counties. Altogether, these counties are home to roughly 16% of the U.S. population, with 23.5% of the South’s population living in them, compared to 12.6% in the Midwest, 12.5% in the Northeast, and 10.5% in the West.
Early Childhood and Working Households
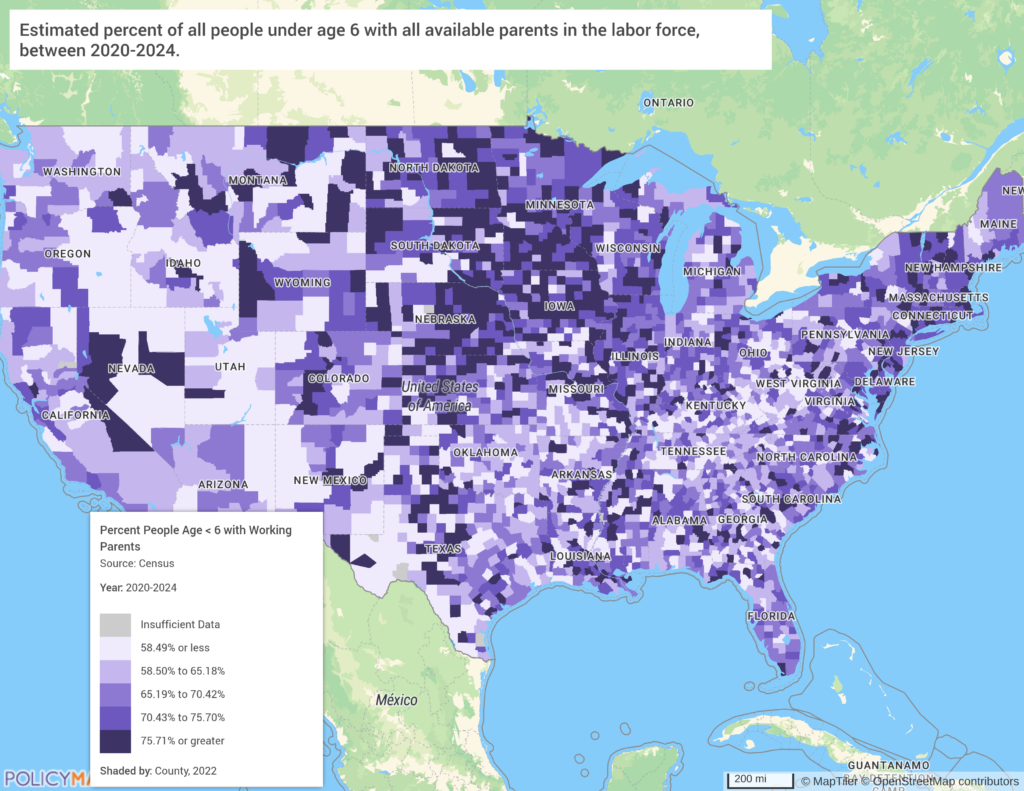
Against a backdrop of persistent poverty, newly available indicators help illustrate how families with young children are navigating the combined demands of work and caregiving. In households with children under age six where all available parents are in the labor force, caregiving and paid work are tightly overlapping, occurring within the same constraints of time, income, and support systems. The data reveal where that intersection of early childhood and full workforce participation is most pronounced.
Rising Rents and Electricity Costs Tighten Affordability
While monthly housing costs for homeowners remained relatively stable between the 2015-2019 and 2020-2024 periods, renters experienced a sharper increase, with renters in 20% of counties paying more than compared to the previous five-year period.
Utility costs often have less flexibility in household budgets. New indicators track the share of households spending $100 or more, and $200 or more, per month on electricity, providing a clearer picture of where higher utility burdens are most concentrated. The darkest purple illustrates where 50% or more households are paying $200 or more for electricity.
Where Economic Pressures Converge
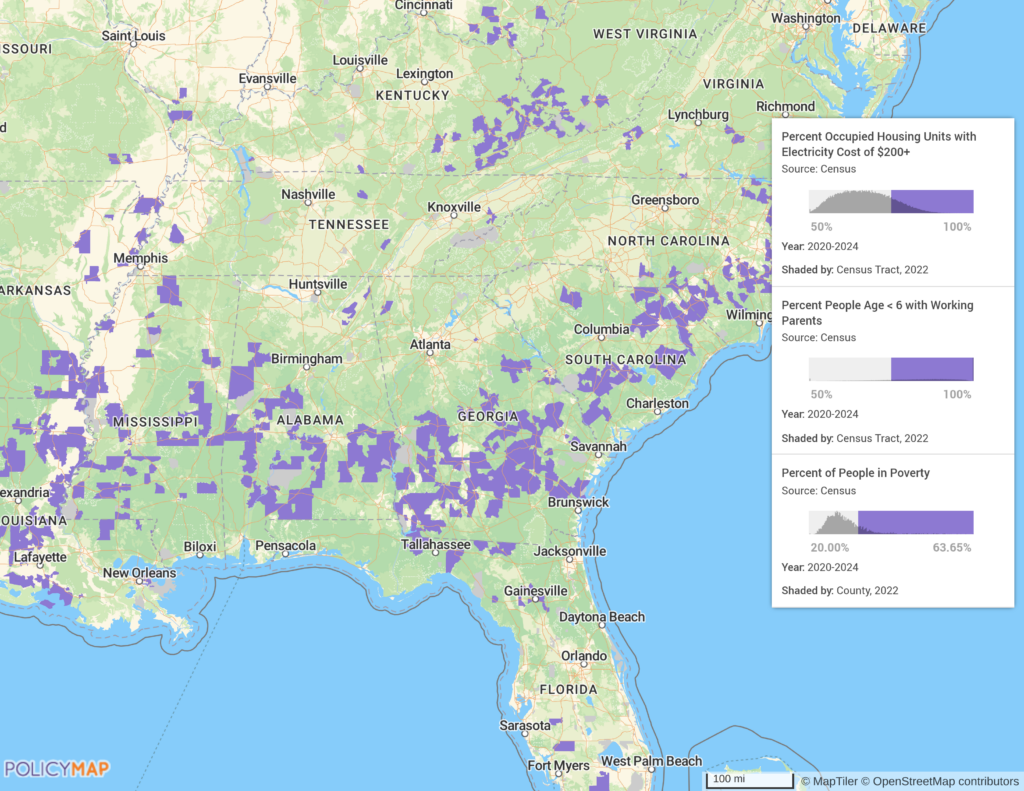
Individually, each indicator captures a distinct dimension of affordability, but when analyzed together, they reveal overlapping geographic patterns of economic pressure. Communities experiencing persistent poverty are often the same places where households face rising rents, elevated electricity costs, and the demands of raising young children while maintaining full labor force participation.
Utility costs are particularly relevant here because, unlike rent or discretionary spending, they do not adjust with income or employment status. When mapped together, counties where poverty rates exceed 20%, more than half of households pay $200 or more per month for electricity, and more than half of children under six have all parents in the labor force, reveal a striking concentration of compounding pressure, particularly across the Southeast. It is only when the data is layered together that the full weight of these overlapping burdens becomes visible.
Explore the data
These new indicators and 10-year percent change are now available on PolicyMap, ready to explore, compare, and layer for deeper insight.
Request More Information
From understanding changing population dynamics to pinpointing socioeconomic shifts, the ACS update provides a wealth of information crucial for making data-driven decisions. Ready to learn more about the data in PolicyMap? Request a demo and data walk-through by completing the form below.