
Using PolicyMap to Identify Populations Vulnerable to COVID-19

Right now, the world feels like a scary place full of unknowns. The coronavirus has completely upended our work and family routines. At PolicyMap, we shut down our center city office and arranged for everyone to work from home. We checked in with our older family members to make sure they had what they needed. We disinfected the bathrooms and kitchens in our homes and we reassured our kids that everything was going to be alright. We went to the grocery store. When we get sick with this virus, we’ll hopefully recover in the warmth of our homes. And, at some point, life before this virus will return to what it once was. We’ll get through this.
This won’t be the case for everyone. The CDC has warned that people who have underlying health conditions like chronic heart disease, lung disease or diabetes are more vulnerable to the virus and are more likely to get very sick. Being poor exacerbates this vulnerability because of limited capacity for preparedness and response.
These populations rely on public health departments across the US — departments which have endured funding cuts for years now. These departments must care for more people with less resources and it’s our hope that PolicyMap can help. By identifying the specific neighborhoods where people are poor, are more likely to have chronic illnesses, or do not have access to primary care doctors or to a full-service grocery store, we can begin to identify those places where targeted interventions now, like meal deliveries or wellness checks, may keep more people healthy.
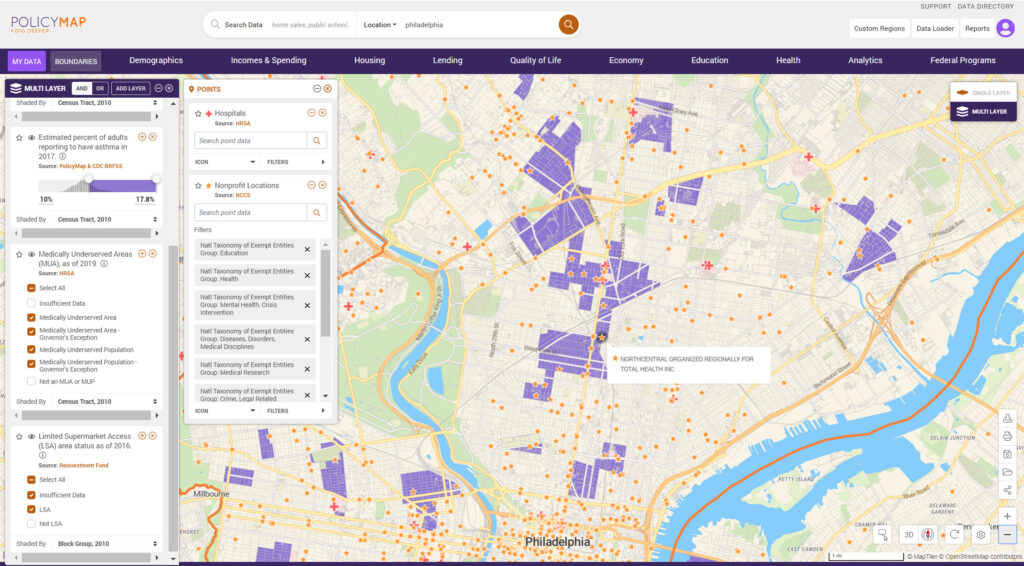
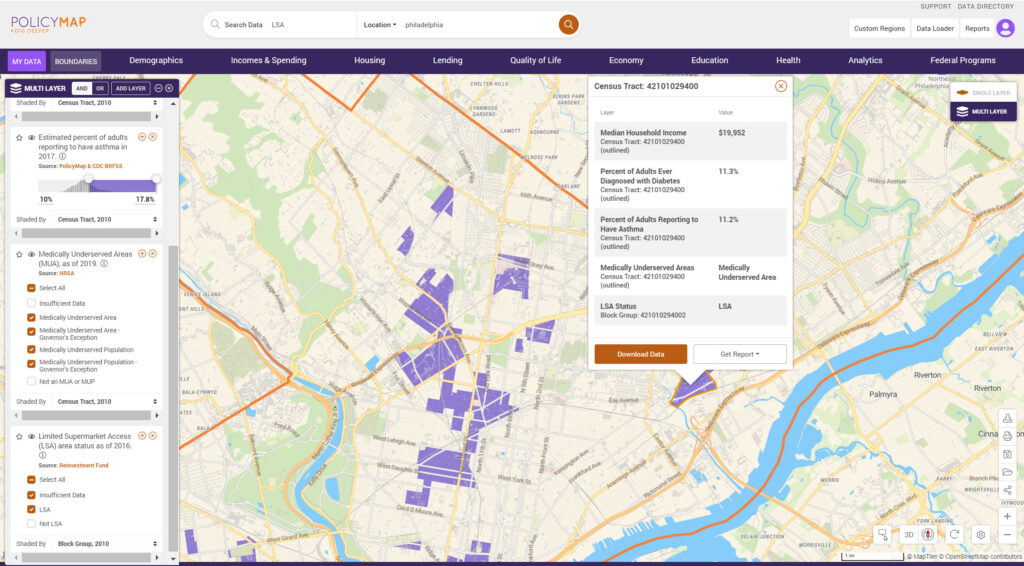
If you take a look at Philadelphia, where our main office is located, you can quickly identify places where the median household income is less than $35,000, more than 10% of people have diabetes, more than 10% of people have asthma, are located in a medically underserved area, and do not have access to a full-service grocery store. Once identified, public health departments can overlay these places with the locations of non-profit agencies and hospitals to identify partners to help deliver quick interventions in these communities now.
Learn how to do this in PolicyMap now.
At PolicyMap we are continually adding reliable data to ensure our users can solve problems and identify solutions that help those who need it most and, ultimately, all of us. Contact us if you have additional suggestions for data that could help with crafting strategies to address the challenges of the pandemic of our time.