
Data Points – Loading Data and Filters
Data Points allows users to view point datasets, like addresses, on the map. You can view these sites by themselves or on top of a thematic data layer. Subscribers and trial users can add datasets that they have loaded using the Data Loader tool. Once a dataset is loaded, click on any point to display information about that site in the info bubble.

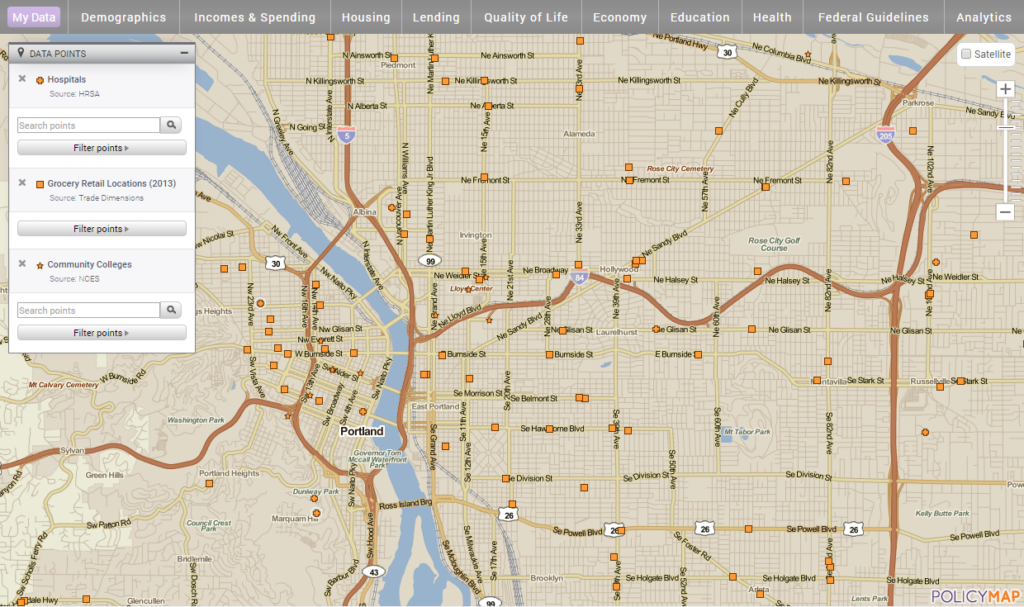
Once Data Points are loaded, the legend will appear on the map and users can select the icon on the map to see more information about that location.
![]()
Data Points (Learn more about Data Points here) – Data Points allows you to view point datasets, like addresses, on the map. You can view these points by themselves or on top of a Data Layer. Subscribers and trial users can add datasets which they have loaded using the Data Loader tool from their My Data tabe. Once a dataset is loaded, click on any point to display information about that site in the info bubble.
 Data Points Legend After loading a point dataset, users can use the legend to filter points on the map or search.
- Add multiple point datasets to you map: Simply click on each one you wish to add from the menu.
- Filter datasets: To use the filter option, simply select the filer from the menu in the legend You can apply multiple filters to any dataset.
- You can remove any site dataset or a filter(s) by clicking X symbol in the legend.
Data Points Filters – Use the filters option to show only address(es) that match a specific filter or even color code. To use the filter option, select the filter button in the legend and a menu of filter options will appear, select the indicator you want to filter by. For example, if you load Lending > Bank Branches, you can then choose to filter and show only full service branch locations.

 If a point (address level) dataset has multiple indicators, users can then select multiple filters. Another example would be if you load the Housing > HUD Multifamily dataset and open the Info Bubble, you will see multiple tabs with lots of data for each multifamily site. Most of the indicators for each locations can be used as filters allowing users to find a specific group of addresses. So with the HUD Multifamily data, users can select to show addresses with a “Contract Status” of active AND an “Owner Company Type” of non-profit. The map will now only show address that match the two indicators. Select the X symbol in the legend to remove any filters added.
Color Code All Filter – this option will display each address by specific color and each color will represent a type of data for the indicator selected. For example, load Health > Hospitals and select the “color code all” option for Faculty Type. This will now show each type of facility by their colors shown in the Add Sites legend; orange are Childrens, white is Short Term, green is Long Term, etc.

We’ve reorganized the datasets for Data Points, so is where each dataset is now located. You will noticed that some datasets are in multiple locations;
- Housing
- Federal Housing – Federal Housing sites contain Multi-Family and Public Housing locations from HUD and USDA, Nursing Facilities from HRSA, and HUD Low Income Housing Tax Credit (LIHTC) locations.
- Local Foreclosure Data – Subscribers and trial users have access to foreclosure filings and actions in the Chicago area and Kane County.
- Lending
- Banking – The FDIC releases data on branch locations and bank failures and assistance transfers of financial institutions.
- New Markets Tax Credit Investments – This will display NMTC Community Development Entities.
- Local Foreclosure Data – Subscribers and trial users have access to foreclosure filings and actions in the Chicago area and Kane County.
- Quality of Life
- Environment –Superfund sites and Brownfield locations from the U.S. Environmental Protection Agency (EPA).
- Grocery Retail Access – See the Reinvestment Fund’s study of Limited Supermarket Access areas throughout the nation. Subscribers can see leakage amounts, rates, and demands, and also grocery retail locations from Trade Dimensions.
- Institutions – Users can see all nonprofit locations from the Urban Institute’s National Center for Charitable Statistics or library locations from the Public Libraries Survey.
- Education
- Schools– Public, private, and charter schools as reported by GreatSchools, Inc. Subscribers and trial users can see school performance scores and basic data for each school.
- Health
- Hospitals and facilities – from the Health Resources and Services Administration (HRSA), Federally Qualified Health Centers and Look A-Likes.
- Retail-Base Healthcare – locations from the Convenient Care Association
- Nurse Practitioner-Led Clinics – from the Nation Nursing Center Consortium
- Food and Grocery Retail Access – See the Reinvestment Fund’s study of Limited Supermarket Access areas throughout the nation. Subscribers can see leakage amounts, rates, and demands, and also grocery retail locations from Trade Dimensions.
- Federal Guidelines
- US Department of Housing and Urban Development – This will display HUD related programs like Low Income Housing Tax Credits (LIHTC), Multi-Family, and Public Housing
- US Department of Agriculture – The USDA Rural Development Multifamily sites can be found here.
Be sure to check the links for each unique feature in the tutorial. We’ve highlighted them on this overview, but each link will describe more information and functionality. If you have any questions or want to lean more, visit our training calendar and attend a free session or contact us at any time.
To read a full guide on all features on PolicyMap, please look at our Primer available here