
New Data on Racial Disparities in Housing & Homeownership, Powered by PolicyMap
The NYU Furman Center’s Housing Solutions Lab launched the Housing Needs Assessment Tool (HNAT) in partnership with PolicyMap in 2021 to help policymakers, practitioners, and community leaders understand data in ways that can inform a local housing strategy.
The Housing Solutions Lab recently added several new measures focused on disparities in housing, breaking down key indicators by race and ethnicity, showing neighborhood poverty rates for various federally subsidized housing programs, and showing trends in the racial homeownership gap to their mapping tool powered by PolicyMap.
Many cities across the United States have a history of exclusionary and discriminatory housing policies. Addressing the continuing effects and harms of these policies and practices require intentional and innovative evidence-based strategies. Disaggregating housing data by race and ethnicity can help policymakers and practitioners identify housing disparities in their communities and begin to design policies to address them.
Learn more about the causes and consequences of segregation by race, ethnicity and income, and how some cities are taking steps to acknowledge and address them.
New HNAT Indicators Illustrate Racial Housing Inequities
The HNAT now includes a section that consolidates the various indicators related to housing disparities found in each jurisdiction’s report. These include:
- Poverty Level and Trend by Race and Ethnicity
- Share of Renter Households Moderately or Severely Cost Burdened by Race and Ethnicity
- Homeownership Rate by Race and Ethnicity
- Homeownership Rate Trend by Race and Ethnicity
- Severely Crowded Households, by Race and Ethnicity
- Average Neighborhood Poverty Rate for Federally Subsidized Housing by Subsidized Housing Type*
(This metric is also available to PolicyMap subscribers in the Incomes and Spending tab in the Poverty section.) - Average Neighborhood Poverty Rate by Race/Ethnicity*
- Dissimilarity Index*
*These indicators were calculated by Policy Solutions, part of ReInvestment Fund.
Share of Renter Households Moderately or Severely Cost Burdened by Race/Ethnicity: Gresham, OR (2020)
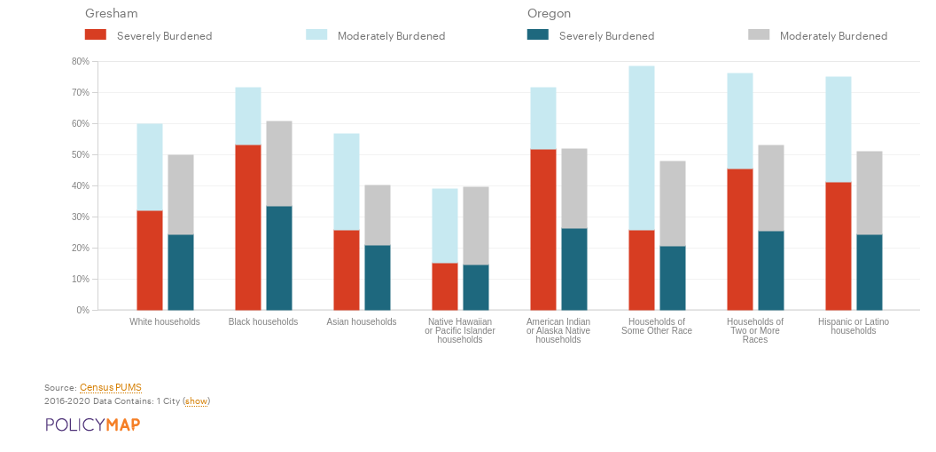
Cost-burdened is defined as 30% or more of household income being dedicated to rent and utilities. In Gresham, approximately 75% of Hispanic households are moderately or severely rent burdened compared to nearly 51% of Hispanic households across the state of Oregon.
New Data in “Dedicated Affordable Housing” Section
A new measure highlights the average poverty rate for all neighborhoods where each type of federally-subsidized housing program (Housing Choice Vouchers, Public Housing, Low Income Housing Tax Credit properties, and HUD Multifamily properties) is located. High average neighborhood poverty rates for federally subsidized housing can indicate that units are unevenly distributed within a jurisdiction or concentrated in neighborhoods with limited educational and economic mobility opportunities.
Average Neighborhood Poverty Rate for Federally Subsidized Housing by Subsidized Housing Type: Syracuse, NY (2020)
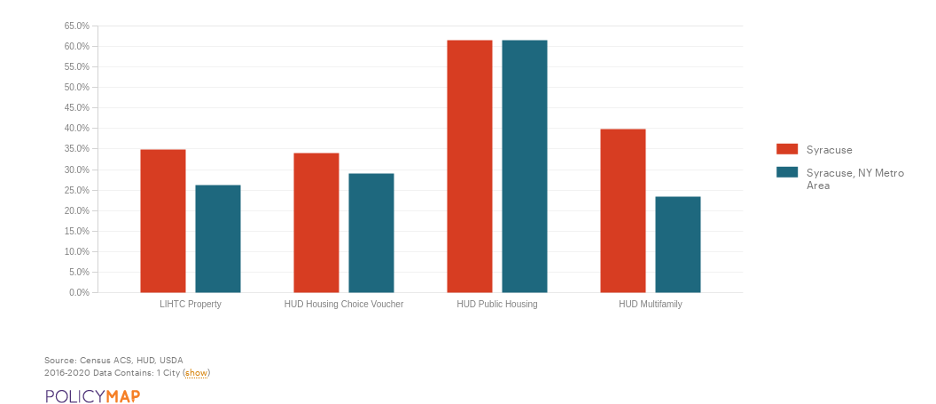
In Syracuse, the average neighborhood poverty rate was highest for households living in HUD Public Housing units. HUD Public Housing units were, on average, located in neighborhoods where 61.4% of the population had incomes below the federal poverty line. The average neighborhood poverty rate was lowest for households living in HUD Housing Choice Voucher units. HUD Housing Choice Voucher units were, on average, located in neighborhoods where 33.8% of the population had incomes below the poverty line.
Learn more about the research, and ways to strengthen resources in high poverty neighborhoods.
New Maps in “Neighborhood Variations” Section
Three new maps have been added to the “Neighborhood Variations” section of the Housing Needs Assessment: Homeownership Rate by Neighborhood, Median Home Values By Neighborhood, and Change in Median Home Value by Neighborhood. Understanding homeownership variations across neighborhoods can help to target a mix of affordable housing programs and policies, while variations in median housing prices across neighborhoods indicates where opportunities for creating affordable homeownership exist. Using all three of these maps together can offer additional trends and insights.
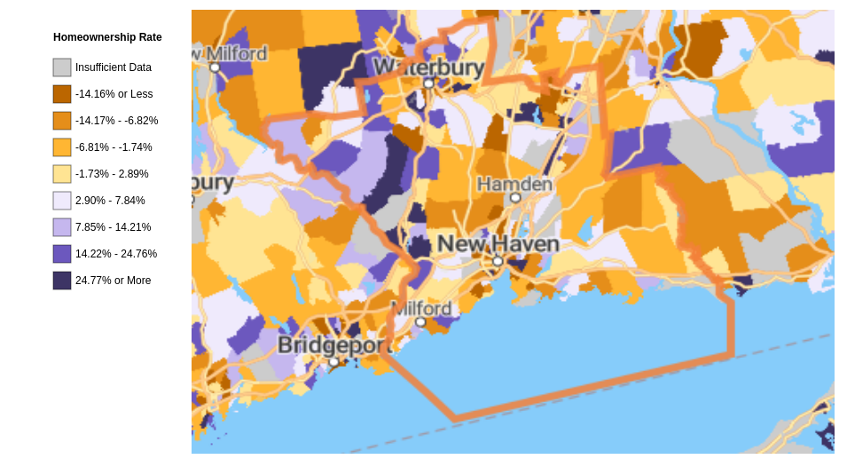
Homeownership Rate by Neighborhood: New Haven, CT (2020)
Median Home Values By Neighborhood: New Haven, CT (2020)
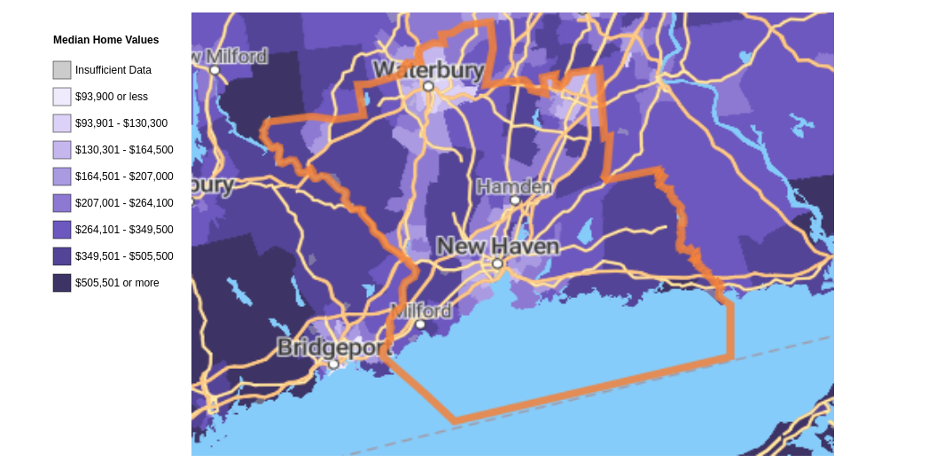
As of 2020, the median home price in New Haven, CT was $252,300. The map illustrates variation in median home prices by census tract in New Haven as of 2020.
Change in Median Home Value by Neighborhood: New Haven, CT (2020)
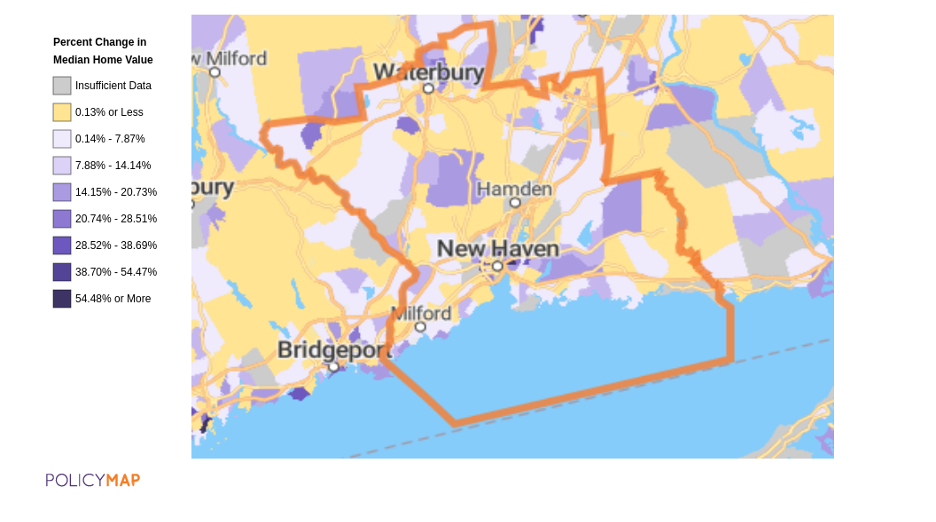
This map illustrates the change in median home prices in New Haven, CT between 2015 and 2020 by census tract.
Other Features, and Feedback
In addition to these updates, we’ve added a “Dissimilarity Index”, which breaks down neighborhood diversity with a simple 0-100 score, a count of Housing Choice Voucher-assisted units, and a Data Dictionary to provide additional details about the sources and methodology used for each figure and statistic in the comprehensive report.
To contact the Housing Solutions Lab with ideas or suggestions about how to further refine the HNAT, visit “Ask the Lab”. They are continually revising and improving the tool, and welcome user feedback and requests.
For questions about accessing and using select indicators available in the Incomes and Spending tab in the Poverty section, please use the form support page.
For inquiries about Branded Mapping Platforms powered by PolicyMap, please request more information here.