|
|
|
|
|
|
|
|
|
FEATURED POST |
|
|
2025 in Review: PolicyMap’s Top Blog Posts
As we close out 2025, we’re reflecting on the stories that resonated most with our readers. This edition highlights the most-read blog posts of the year, featuring the data-driven insights and platform updates that mattered most. Thank you for being part of our journey—here’s to continued impact in 2026.
|
|
|
|
|
|
 |
|
|
STANDOUT STORIES FROM 2025 |
|
|
 |
|
Implications of the One Big Beautiful Bill Act for Housing and Community Development Programs
As debate around the One Big Beautiful Bill (BBB) Act continues, most attention has centered on its impact on the federal deficit and steep cuts to safety-net programs like Medicaid and SNAP. But hidden within the BBB are key housing and community development provisions with real potential. From expanded Low-Income Housing Tax Credits to a renewed push for Opportunity Zones, PolicyMap unpacks how these proposals could unlock long-term investments in affordable housing—especially in the communities that need it most.
Read More |
|
 |
|
How Healthcare Organizations Can Leverage Opportunity Zones for SDOH Funding
Proposed expansions to Opportunity Zones could bring new funding opportunities to healthcare organizations tackling Social Determinants of Health (SDOH) like access to care, food security, and housing stability. Traditionally geared toward housing and commercial development, Opportunity Zones now offer a powerful way to align community investment with health-focused initiatives. This expansion presents a pivotal moment for healthcare organizations to integrate SDOH solutions into broader economic strategies. Learn how to identify Opportunity Zones and tap into this funding potential.
Read More |
|
 |
|
How to Conduct a Housing Needs Assessment Using PolicyMap: A Case Study in Indianapolis, IN
Home prices in Indianapolis have surged by more than 80% since 2013, leaving many households, especially in the city’s core, struggling to keep up. PolicyMap demonstrates how a housing needs assessment that integrates affordability, accessibility, and housing quality can help leaders understand not just where shortages exist, but why they persist. Explore how local governments and nonprofits can use data-driven insights to target reinvestment and align housing with real community needs.
Read More |
|
 |
|
Digging Deeper: Mapping Maternal Health
Maternal health is a pressing issue in the United States, highlighted by decreases in obstetric services and increasing maternal morbidity. PolicyMap users can integrate datasets like area demographics, chronic health conditions, deprivation indexes, and poverty rates with Surgo Health’s Granular Maternal Vulnerability Index (gMVI) for a nuanced understanding of maternal health challenges. Explore how this powerful tool can improve help outcomes and advance equitable care.
Read More |
|
 |
|
How Cutting CDFI Funding Hurts Homebuyers
Community Development Financial Institutions (CDFIs) are lifelines for low-income communities, providing affordable loans to homebuyers, small businesses, and essential services often overlooked by traditional banks. Reducing or defunding CDFIs would dismantle this crucial support system, cutting off financial access for those who need it most. In this article, we explore, as an example, how CDFIs benefit homebuyers across the state of Mississippi.
Read More |
|
 |
|
Where Baby Boomers Are Booming: The Silver Wave Reshaping America’s Economic Landscape
As Baby Boomers retire in record numbers, states like Maine, Florida, Vermont, and Montana are facing dramatic shifts in healthcare, housing, and workforce needs. Understanding these patterns is crucial for policymakers, businesses, and communities aiming to navigate the challenges and opportunities presented by an aging population. PolicyMap’s latest analysis shows how this trend known as the “Silver Wave” is changing local economies and what communities might do to keep up.
Read More |
|
 |
|
Mapping the Impact of SNAP Benefit Reductions During the Federal Shutdown
During the recent federal government shutdown, disruptions to SNAP funding left millions of Americans facing uncertainty about how they would afford groceries. While the shutdown has ended, the data remain critical. Explore how organizations can use PolicyMap to identify where benefit reductions hit hardest—and apply those insights to guide more targeted, data-driven responses moving forward
Read More |
|
 |
|
How We Used the Moody’s Analytics Housing Gap Data to Craft a $2 Billion, 30,000 Unit Housing Plan in Philadelphia
Philadelphia’s $2 billion HOME initiative takes a data-driven approach to solving the city’s housing crisis, targeting the creation and preservation of 30,000 units. With housing gap estimates from Moody’s Analytics, PolicyMap, and Reinvestment Fund guiding every step, the plan aligns funding, location, and affordability with precision. See the data that is driving real-world change in one of America’s most housing-challenged cities.
Read More |
|
 |
|
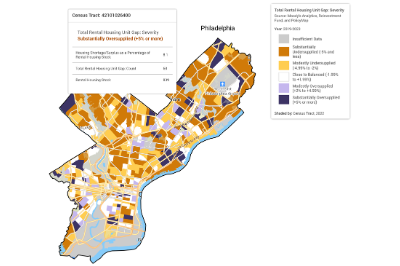
Preserving LIHTC Units: A Key Strategy in Addressing Housing Shortages
New research from Moody’s Analytics, PolicyMap, and Reinvestment Fund shows that in low-income neighborhoods, rental units make up 80% of the housing stock. With many Low-Income Housing Tax Credit (LIHTC) properties nearing the end of their affordability periods, the risk of losing units in already strained markets is growing. See how PolicyMap’s integration of housing gap data with LIHTC timelines helps planners, policymakers, and advocates anticipate where rental shortages could deepen and where preservation efforts are most critical
Read More |
|
 |
|
The “Forgotten Middle”: Using PolicyMap to Support Middle Neighborhoods
Middle neighborhoods are often overlooked by policymakers despite being vital to urban stability. These “forgotten middle” areas sit on the edge of decline, but targeted investment can preserve their strength and promote equity. Discover how PolicyMap’s tools can help identify and support these neighborhoods before it’s too late.
Read More |
|
 |
|
Analyzing Housing Supply and Affordability in Chicago Neighborhoods
New data from PolicyMap and Moody’s Analytics reveals how widespread Chicago’s housing shortage has become. Nearly every neighborhood, from Logan Square to Bridgeport, shows some degree of undersupply. Driving home prices far beyond what middle-income households can afford. By pairing Housing Gap Estimates with Census home values, PolicyMap helps city leaders pinpoint where scarcity drives costs, where oversupply signals disinvestment, and where targeted policy interventions are most needed.
Read More |
|
 |
|
Childcare Costs Take a Growing Share of Family Income
In counties across the United States, childcare costs can become incredibly burdensome. Full-day infant care can cost a typical family anywhere from around 5% to 30% of the median family income. New data from the National Database of Childcare Prices (NDCP), now on PolicyMap, shows just how steep these costs have become and how unevenly they fall on families. Explore where childcare costs put the greatest pressure on family budgets and how affordability differs across states and counties.
Read More |
|
|
|
|
|
|
|
|
|
 |
|
|
STANDOUT NEWS FROM 2025 |
|
|
 |
|
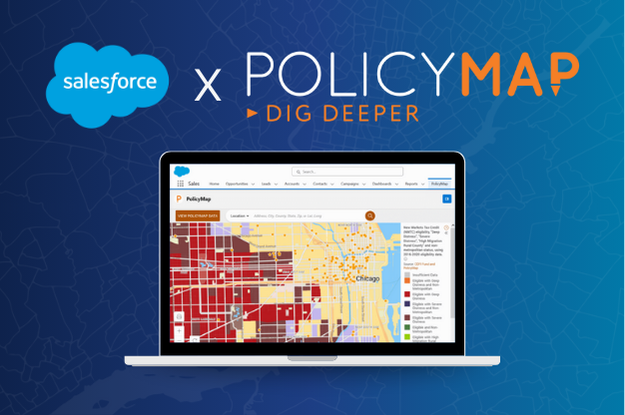
Introducing PolicyMap for Salesforce–Our New Salesforce App!
Bring PolicyMap’s reliable neighborhood data and state-of-the-art mapping into Salesforce! Gain real location context about the communities you serve, right where you already work. Power smarter decision-making, investing, reporting, and grant-making by connecting market data directly to your Salesforce.
PolicyMap for Salesforce enriches your Accounts, Opportunities, and Leads with demographic, housing, and health data, helping you quickly identify which records sit in areas that meet program criteria or qualify for community-based incentives. Ideal for nonprofits, lenders, community development organizations, government agencies, and healthcare teams, the app gives both new and existing PolicyMap users seamless, in-platform access to trusted data and neighborhood-level insights.
Read More |
|
 |
|
New PolicyMap and Moody’s Analytics Report Reveals Neighborhood Level U.S. Housing Shortage Analysis
Where exactly is the housing shortage hitting hardest? A new neighborhood-level analysis from PolicyMap, Moody’s Analytics, Reinvestment Fund, and Urban Institute uncovers a two million–unit gap—showing not just how many homes are missing, but where, for whom, and what kind.
Read More |
|
 |
|
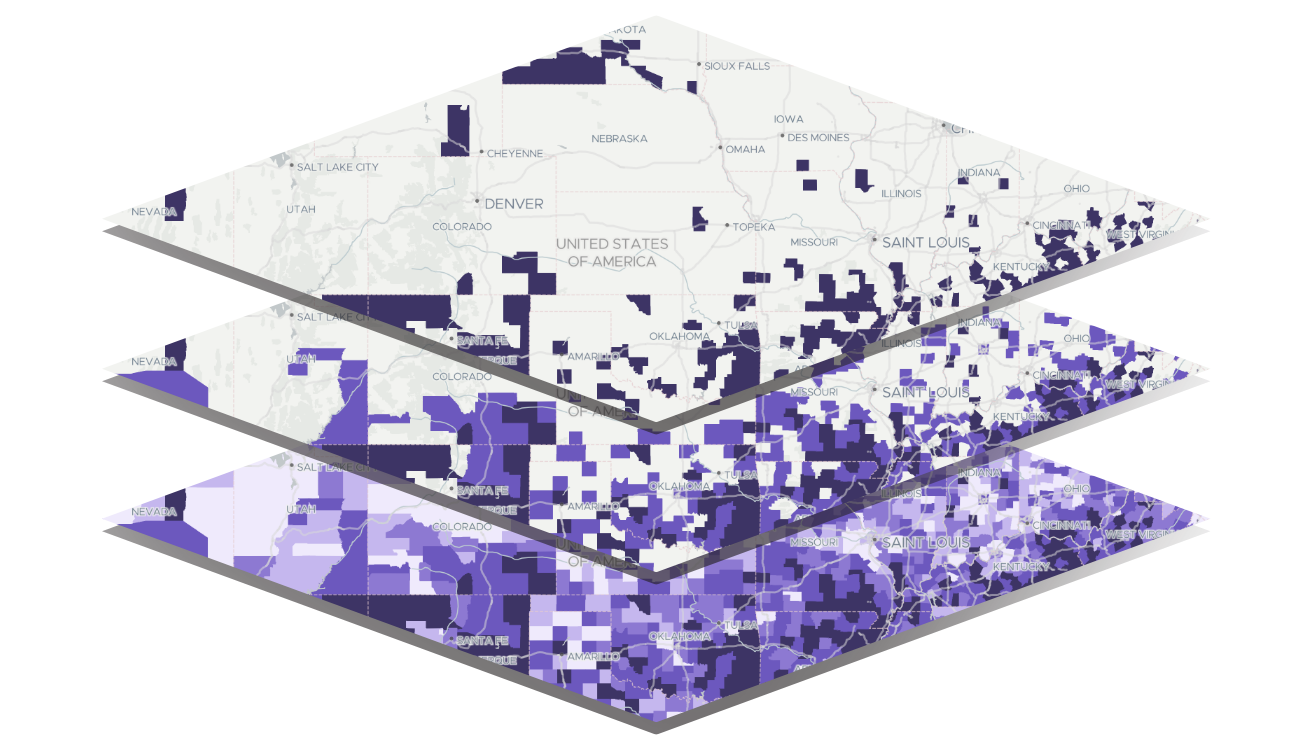
The Power of Intersection: Multi-Layer Maps
The Multi-Layer mapping tool is one of the most powerful features in the PolicyMap platform. It allows users to combine up to five data layers, apply conditions to each, and quickly identify geographic areas where those layers intersect or overlap. Explore how new enhancements help you zoom further, clip smarter, and download results for deeper analysis.
Read More |
|
|
|
|
 |
|
 |
|
In 2025, PolicyMap introduced many new datasets and updated hundreds of existing indicators, ensuring users have access to the latest and most comprehensive data to support their initiatives.
Below is a selection of our most sought-after datasets.
*NEW DATA*
Housing Gap Estimates from Moody’s Analytics, PolicyMap, and Reinvestment Fund have been added to PolicyMap. The Housing Gap Estimates use American Communities Survey data to estimate the level of units of housing, both owner and renter, a given census tract is short. Data is available for the most recent 5 year ACS period (2019-2023), and for census tracts within 350 of the largest cities in the United States.
Claritas PRIZM® Premier is now available on PolicyMap! This detailed segmentation dataset offers insight into consumer behavior and lifestyle patterns across 68 demographic groups.
The CDFI Fund’s New Markets Tax Credit (NMTC) Eligibility has been updated to include a new eligibility criterion: “High Migration Rural County”.
FEMA Disaster Assistance has been published on production. This dataset is broken into three categories in the taxonomy: Individual & Household Assistance, Public Assistance, and Property Damage. Each category includes a layer for all disasters, and disaster-specific layers.
Niche is a platform that provides rankings for schools based on public data and user reviews. Niche is replacing GreatSchools, with key differences including the incorporation of data on school demographics, administrative details, graduation rates, AP course offerings, etc.
Pharmacy location data from Data Axle has been updated to 2025. This update includes a *new filter*, “Store Status”, that can be used to identify pharmacies that closed between August 2024 and May 2025.
New Data displaying Medicare-Accepting Provider locations from CMS, including the ability to filter to provider specialty, has been added to PolicyMap.
The Credit Insecurity Index data has been newly added to PolicyMap. This data from the Federal Reserve Bank of New York measures the ability of households to access mainstream credit and keep current on debt payments.
CRA small business and small farm loan data is updated through 2023. This is a full data refresh, adding more historical data to the “Leading Lenders.” This includes the expansion of lending from the banks over time.
Census County Business Patterns Establishments are now available on production.
Urban Institute Medical Debt Estimates has been added to PolicyMap. It includes estimated medical debt and median medical debt, with breakdowns by key demographics.
New Data from BLS that shows industry specialization at the county and state level has been added to PolicyMap. This data comes from an already existing dataset: BLS Quarterly Census of Employment and Wages (QCEW), which provides detailed data on employment and wages by industry.
New Data enhancement layers on predominant housing tenure are now available on PolicyMap. This data uses ACS 5-year estimates to identify whether most occupied housing units in a geography are owner-occupied or renter-occupied. Disaggregations are available by race and ethnicity to explore which tenure type is more common within each group individually.
The U.S. Department of Labor National Database of Childcare Prices dataset is now available on PolicyMap.
PolicyMap calculated three new health datasets: predominant chronic conditions, chronic conditions prevalence, and Medicare chronic conditions prevalence.
We are committed to our promise of curated, cleaned, standardized, and always updated data. We’re posting real-time updates on our website and X (formerly known as Twitter).
|
|
|
|
 |
|
Open PolicyMap Training Sessions
Offered twice a week. Register here.
Level 1: Learning the basics of PolicyMap
Level 2: Learn the Data Loader, Multi-Layer Maps, and other Advanced Features
Open to non-subscribers. Course times rotate weekly. Don’t see a time that works for you?
Contact us.
|
|
|
|
![]() |
|
|
|
|
|