
PolicyMap Office Hours: Deeper Insights with New ACS Indicators

Thank you for joining the fourth session in our PolicyMap Office Hours webinar series! In this session, Magdalen Andreoni, Senior Data Analyst, provides a brief overview of ACS and 5-year estimates, and walks through newly added indicators, including 10-year percent change, updated demographic measures, and new housing and income data.
Take a closer look at how PolicyMap handles shifting geographic boundaries to ensure reliable comparisons over time. This session includes:
- Overview of ACS and 5-year estimates
- New demographic, housing, and income indicators
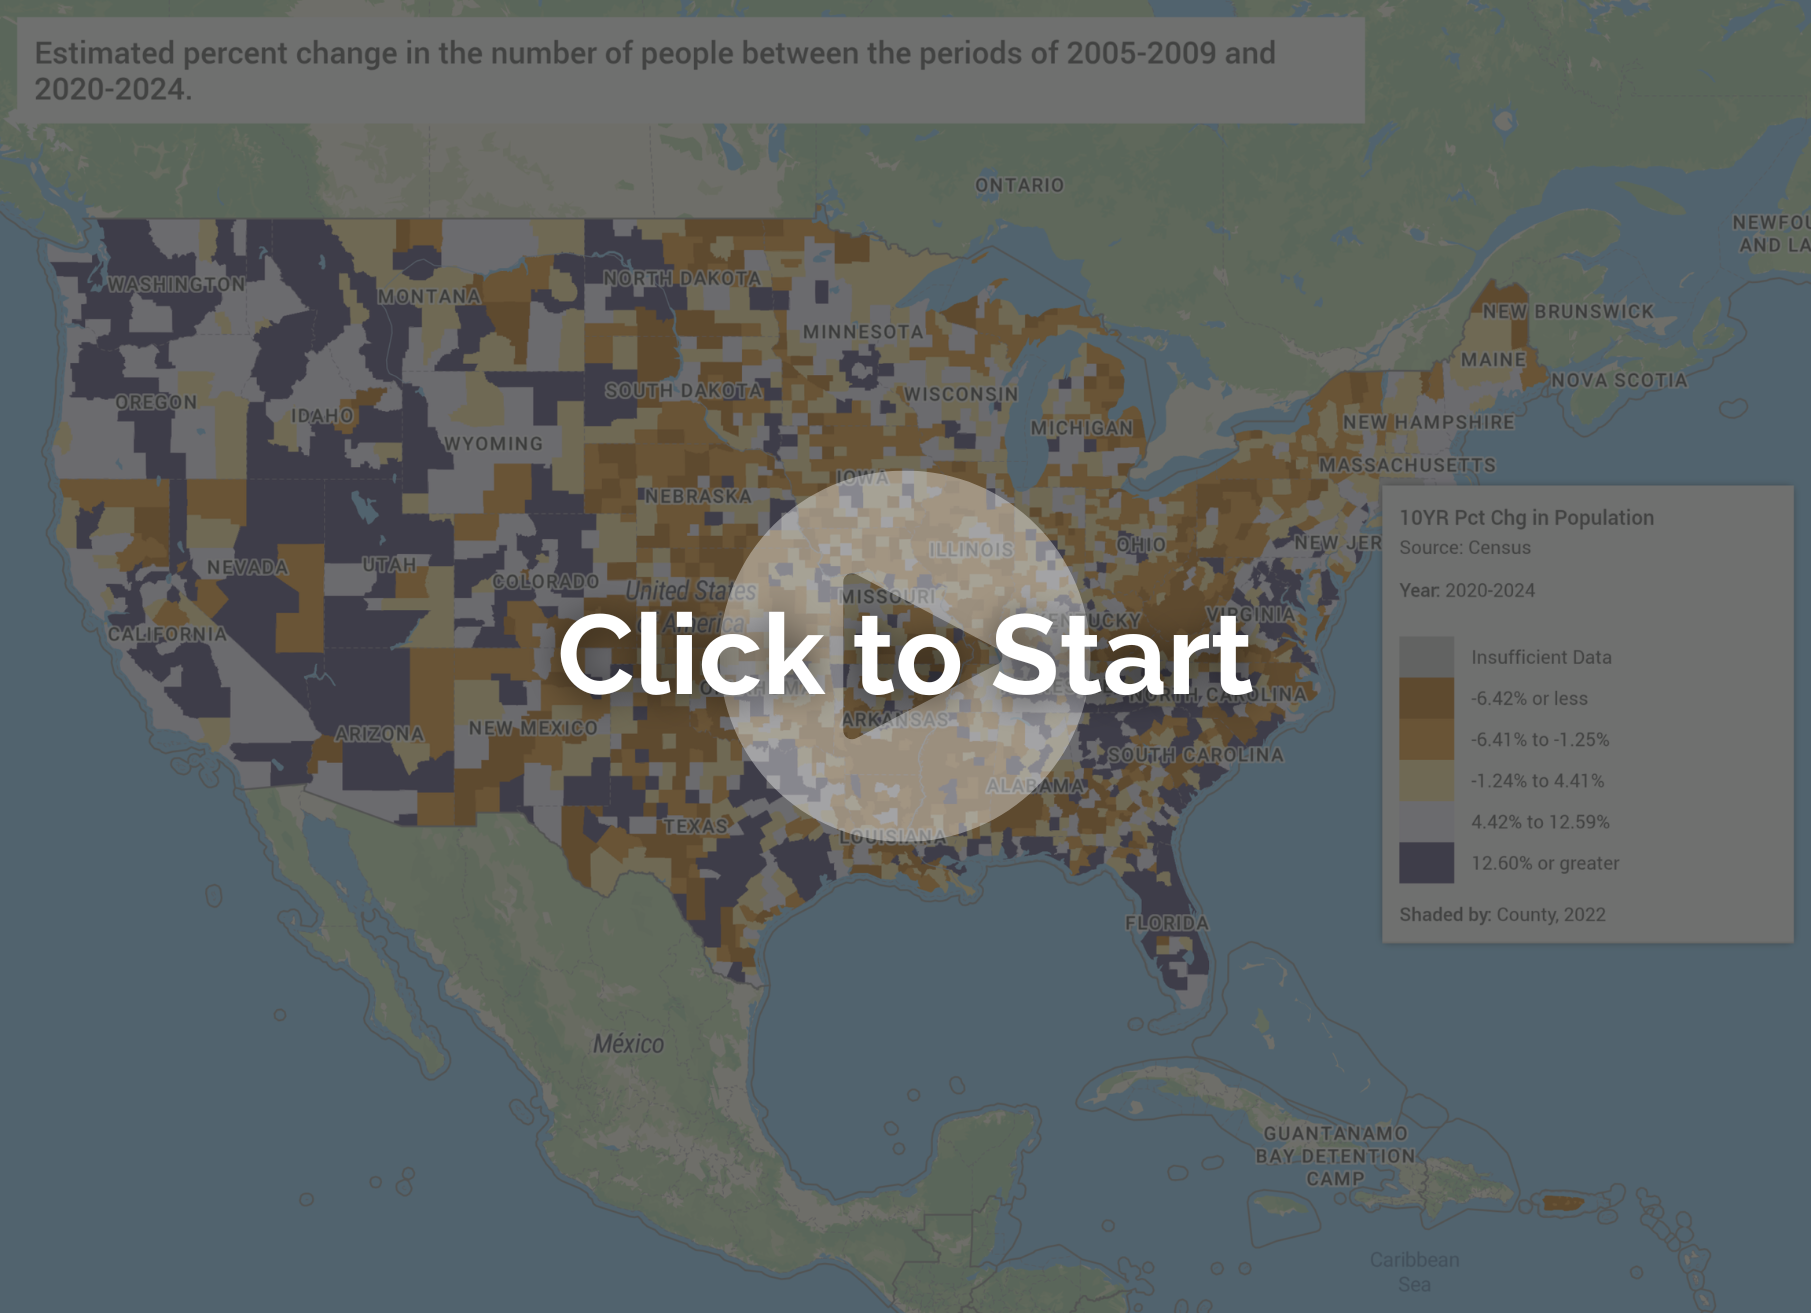
- Deep dive into 10-year percent change methodology
Deeper Insights with New ACS Indicators
Discover the latest demographic, housing, and income insights from the American Community Survey!
Request More Information
From understanding changing population dynamics to pinpointing socioeconomic shifts, the ACS update provides a wealth of information crucial for making data-driven decisions. Ready to learn more about the data in PolicyMap? Request a demo and data walk-through by completing the form below.