
Make An Impact With Good Data
Financial services firms, including CDFIs, investment institutions, and insurance companies, use PolicyMap for site selection and geographic market analysis.
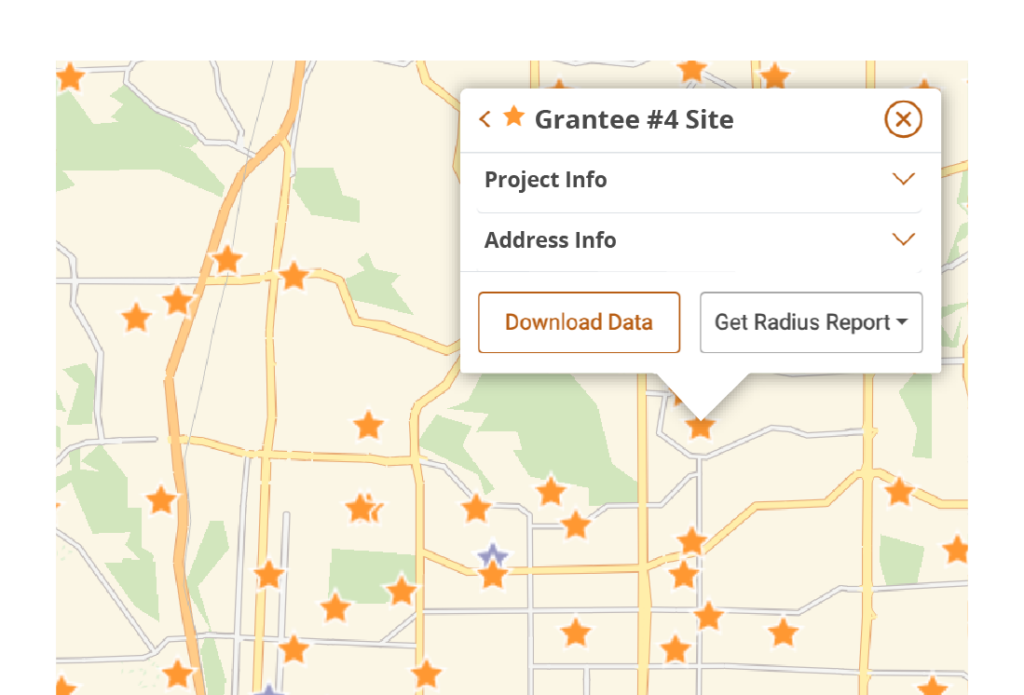
PolicyMap eases the process of identifying CRA and CDFI eligible areas and generating market profiles for potential developments. Use PolicyMap to determine if potential lending opportunities are CRA or CDFI eligible. Run quick and easy market profiles for any radius around a potential opportunity. Or download a list of your investments tagged with CRA or CDFI Eligibility information, or other area income or demographic metrics.


Download: Smarter Business Decisions Through Data
Learn how we help organization make smarter decisions with data across industries. We offer access to over 30,000 indicators from hundreds of different sources through a single vendor. Download our brochure to see available sources for data on real estate, health, banking, jobs, federal incentives, demographics, and more.
Good Data, Smart Decisions.
We’ve curated all of the information you need about a place. PolicyMap organizes the data you need by the topics you care about:

Demographics
Population, race and ethnicity, age, sex, languages, foreign born, migration and immigration, households, families, homelessness, elections, religion

Incomes & Spending
Incomes, poverty, tax returns, federal benefits, bankruptcies, housing burdens, consumer spending, medical spending

Housing
Home sales, rents, building permits, residential & commercial vacancy, subsidized households, public housing, LIHTC

Lending
Mortgage originations, government insured loans, refinance loans, mortgages by race, ethnicity, income, bank branches, credit unions, Historic Lending Boundaries

Quality of Life
Crime, broadband access, time to work, heating fuel types, food access, farmers’ markets, environmental hazards, libraries, museums, parks, disaster risk

Economy
Jobs, unemployment, wages, small business, employment, workforce characteristics, oil and gas production

Education
School enrollment, educational attainment, graduation rates, school performance, cost of college, student loan debt, school locations, college locations, head start locations

Health
Infectious diseases, opioid use, chronic conditions, access to health care, health insurance, health risk factors, federal health programs, health facility locations, food access

Federal Guidelines
NMTC eligibility & investments, Opportunity Zones, persistent poverty, CDBG eligibility, housing opportunity index, CRA eligible areas, SBA HUB Zones, Promise Zones
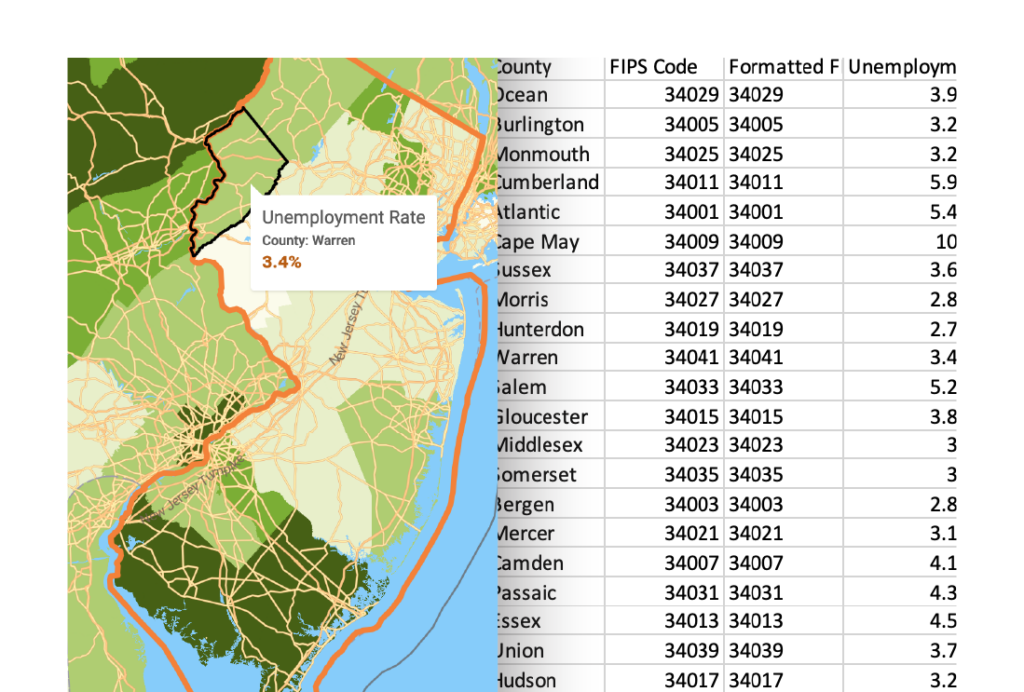
Visualize your own portfolio on top of any of our tens of thousands of indicators. Identify investments that sit in Designated Opportunity Zones, CRA or NMTC eligible areas; see how incomes or populations are changing; track home sale prices. Learn more about access our data.
Customer Story
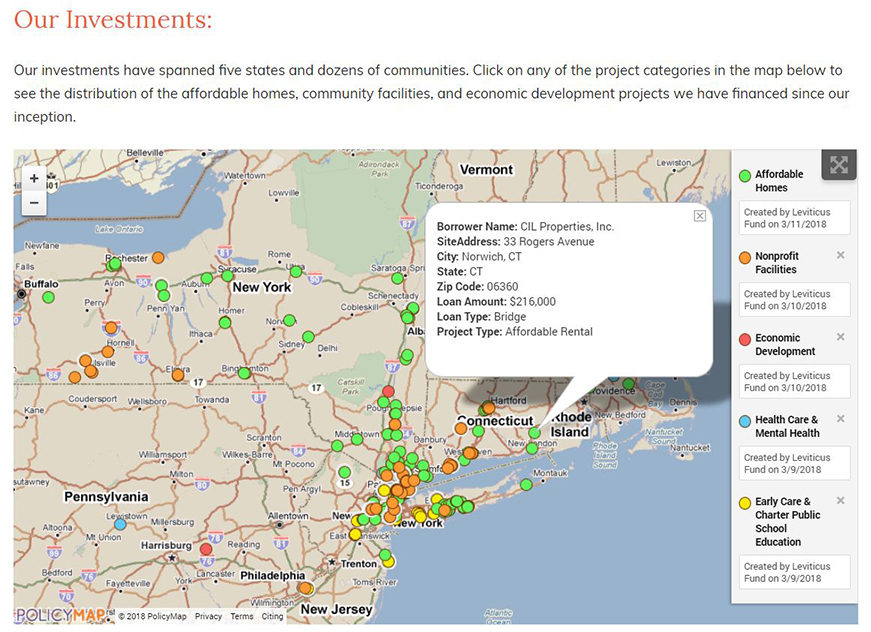
Leviticus Fund
Leviticus Fund, a Community Development Financial Institution (CDFI), uses PolicyMap to create compelling grant applications and to demonstrate the impact of their lending.
“As the pool of grant money continues to decrease, we have to tell a much more compelling story about how we would use that money, and that’s really where PolicyMap has been a tremendous resource.”
—Communications and Compliance Officer, Leviticus Fund
See How PolicyMap Can Help Your Organization.
Target and evaluate your potential investments without spending time looking for data. Let us help you:
- Instantly create maps and generate dashboards with data related to real estate, health, jobs, banking, education, demographics, and more.
- Upload your own location data to leverage against PolicyMap’s data.
- Download data for use in your own research, mapping, and analysis tools.
What You Can Do With PolicyMap
Make maps with your data and ours.
Visualize the impact of your organization or the needs of your community with our exclusive data.
Upload your own data.
Use our unlimited self-service data loader to overlay your address-level data on top of PolicyMap’s.
Download our data.
Use our data in your own research, mapping and presentation tools.
Gain insights with reports.
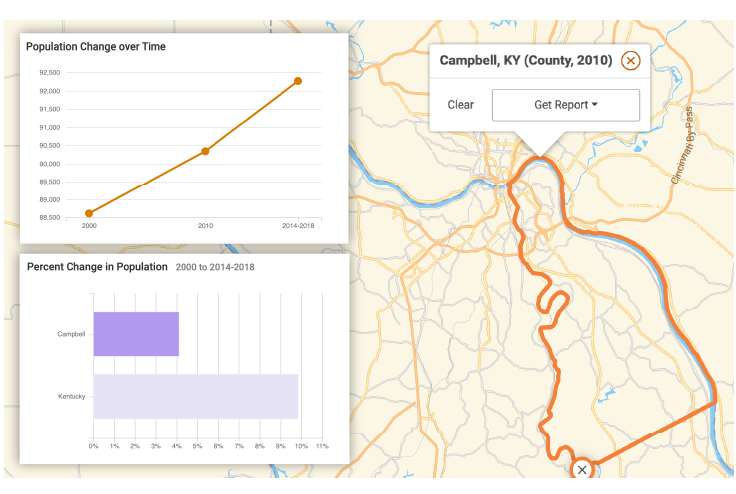
Instantly run community profiles for your community or a custom area.
Find areas with overlapping criteria.
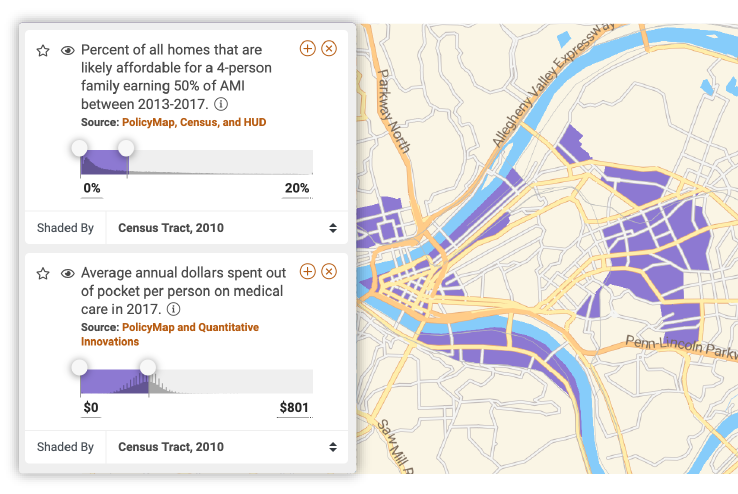
Analyze your community with multi-layer maps for hot spots, or to identify gaps.
Join Our Mailing List
Sign up to receive data driven stories, insights and updates from the PolicyMap team.