
A Closer Look: Foreclosure
![]()
“We have launched a housing plan that will help reasonable families facing the threat of foreclosure lower their monthly payments and refinance their mortgages.
It’s a plan that won’t help speculators or that neighbor down the street who bought a house he could never hope to afford, but it will help millions of Americans who are struggling with declining home values. Americans who will not be able to take advantage of the lower interest rates that this plan has already helped to bring about. In fact, the average family who refinances today can save nearly $2,000 per year on their mortgage.”
– President Barack Obama – Domestic Priorities to a Joint Session of Congress (2/24/09)
Beyond anecdotes in the media about individuals who bought outside of their means, PolicyMap can help quantify and communicate the types of risks home buyers have been taking with their mortgages.
One measure of risk is the Loan-to-Value ratio, the ratio of the property’s value to how much the buyer is borrowing. Traditional home buying advice suggests a 20% down payment. Such a transaction would have a LTV of .8. An LTV of 1 means that the new buyer put nothing down, financing the entirety of the home purchase through one or several loans.
A home buyer could also have taken out several loans to cover the cost of a property. In this situation a homeowner would have multiple mortgages, including a main loan covering 80% of the property’s price, combined with a smaller loan for the remaining 20%. These loans are often called 80-20 or piggyback loans.
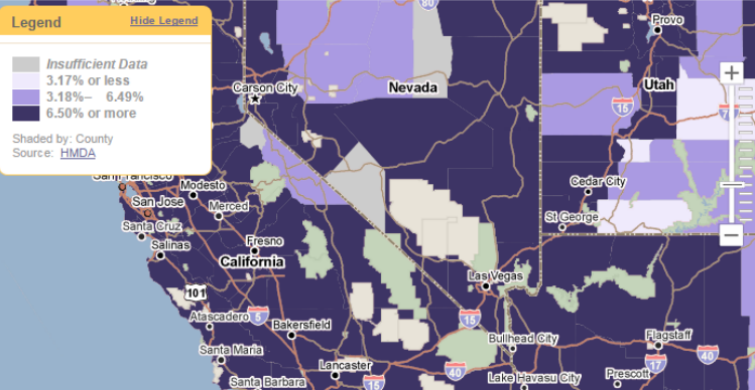
PolicyMap can help show where the type home buyer put little or no money down for their home through two indicators – Loan to Value ratio and Piggyback Loans. We mapped the reported Loan-to-Value ratios of residential home sales for 2007. This map of California shows that the LTVs in these counties were relatively low. On the other hand, the maps that follow of Iowa, Illinois, Indiana, and Ohio look severe by comparison
You can compare these maps of LTV to maps of piggyback lending in 2007. The corresponding maps of California and Illinois area show the percent of home purchase loans that were piggyback loans in 2007. Notice they show the opposite pattern of the maps above. This might be due to regional lending practices and possibly by the types of banks and mortgage brokers making loans in these areas.
This might be due to regional lending practices, the types of banks and mortgage brokers making loans in these areas or the simple need for homebuyers to use two loans just to buy in high priced markets like California.
Stay tuned as we explore how household incomes relate to loan amounts in neighborhoods across the nation. Look for our new Leverage Ratio later this month!