
Creating a Fair Admissions Process in a Post Affirmative Action World

The Supreme Court of the United State’s decision earlier this summer has significantly impacted affirmative action, a policy aimed at redressing historical disadvantages and fostering diversity. Affirmative action, as a means of promoting equal opportunities, has faced legal challenges and debates throughout United States history.
In light of the recent ban on race-conscious admissions, college and university admissions offices are now presented with the challenge to build campus diversity themselves using alternative measures. PolicyMap offers valuable insights into the persistent challenges of achieving equality and equity.
Alternative Indicators to Help Create Diversity on Campus
PolicyMap combines demographic, economic, and social indicators to create interactive maps that reveal disparities across various dimensions. By layering information on income, educational attainment, housing, healthcare, and other factors, PolicyMap provides a comprehensive platform for displaying systemic inequalities. Policymakers, educators, and activists use PolicyMap to quickly identify regions or communities that lack equal access to quality education, employment opportunities, or social resources.
Integrating admissions data with PolicyMap, admissions offices at universities and colleges can enhance their understanding of their applicant pool, identify geographic disparities, and design data-driven strategies to promote the diversity and equity of their student body. The following data sets offer insight on providing equal opportunities to students from all communities.
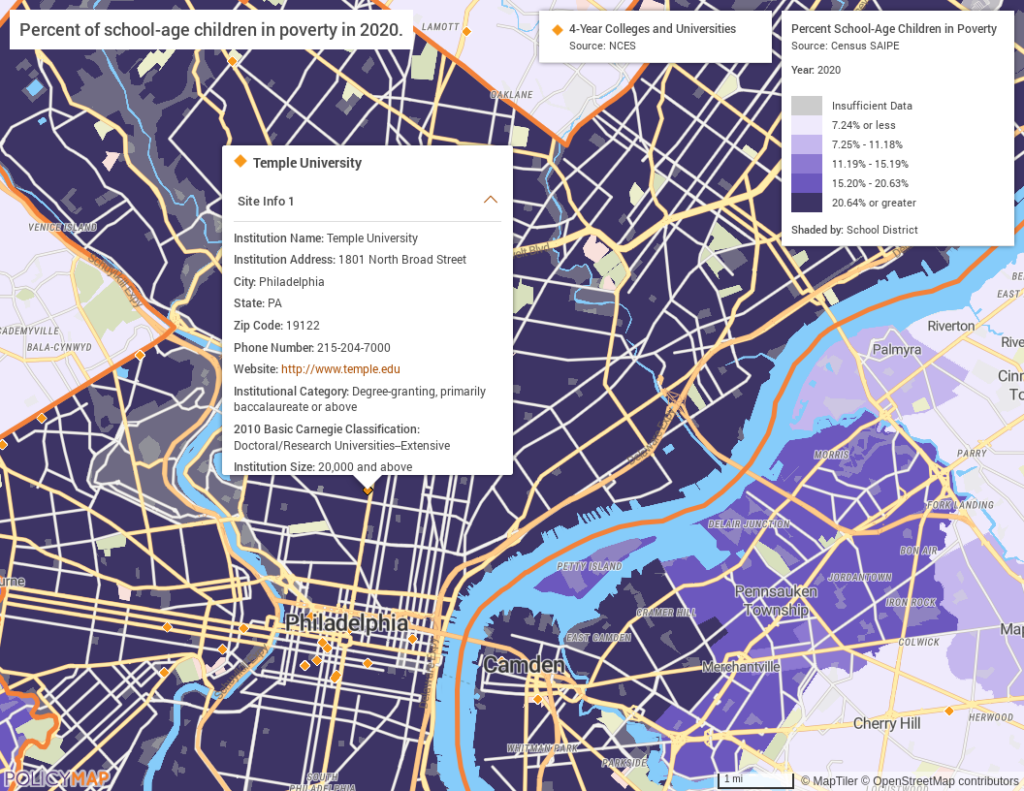
- Educational Attainment: PolicyMap provides data on student achievement, such as proficiency rates in standardized tests, graduation rates, and college enrollment rates. By disaggregating this data by race or ethnicity, researchers can identify gaps in educational attainment between different racial groups.
- Consumer Spending Habits: PolicyMap and Quantitative Innovations (QI) data includes the annual amount spent per household on education.
- School District Statistics: Data from Census Public School Finance provides information on graduation rates, student-teacher ratios, free and reduced lunch recipients, revenues, and expenditures.
- School District Performance: This data includes information such as the distance to the nearest high-performing high school and standardized test performance by the school.
- School Funding: Examining school funding is crucial for understanding resource disparities. PolicyMap offers datasets on per-pupil spending, which a school district or geographic region can analyze. By overlaying racial demographic data, areas where predominantly minority communities receive lower funding, potentially leading to unequal educational opportunities, can be identified.
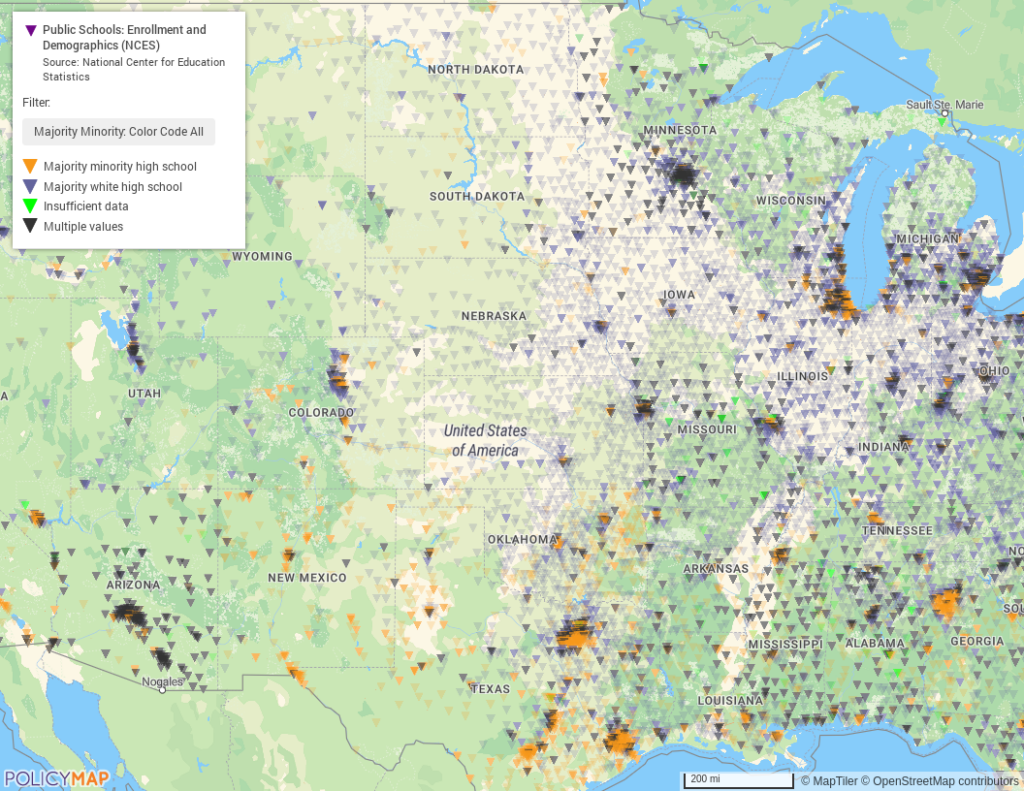
- Public Schools Enrollment and Demographics: The National Center for Education Statistics (NCES) datasets allow for examining school segregation patterns. Educators and stakeholders can explore the racial composition of schools, Title I eligibility (where children of low-income families make up at least 40 percent of enrollment), and student-teacher ratios within a given area. These datasets help visualize and quantify the persistence of racial segregation in educational settings.
- Civil Rights Data Collection: Public Elementary, Middle, and High Schools: This data includes information on limited English proficient students, students with disabilities, student retention (held back), corporal punishment, student suspensions and expulsions, student referrals to law enforcement, school-related arrests, student harassment and bullying, gifted and talented programs, and teacher absences.
- GreatSchools Data: Filtering point-level indicators include a summary rating based on test scores, student or academic progress, college readiness, equity, advanced courses, and discipline and attendance disparities.
- Pre-K and Early Childhood Education: Early childhood education is crucial for setting a foundation for future academic success. PolicyMap provides data on pre-K enrollment rates, availability of early childhood education programs, and the quality of these programs. Analyzing this data through a racial lens can reveal disparities in access to high-quality early education among different racial groups.
- The Diversity Index: The probability that two randomly chosen individuals would be of different races or ethnicities.
It is important to remember that these data sets provide a starting point for analysis and should be complemented with other sources and contextual information to comprehensively understand racial disparities in education.
By visualizing disparities in educational resources, such as school funding, access to advanced courses, or extracurricular activities, admissions offices at universities and colleges can more thoughtfully consider adversity to create diversity. PolicyMap serves as a starting point for informed discussions to address these concerns.
PolicyMap provides a wide lens to visualize and comprehend systemic inequalities. Interested in learning more about this data and other data on PolicyMap? Please fill in the form below to contact us!