Health Matters: May 2025

FEATURED POST

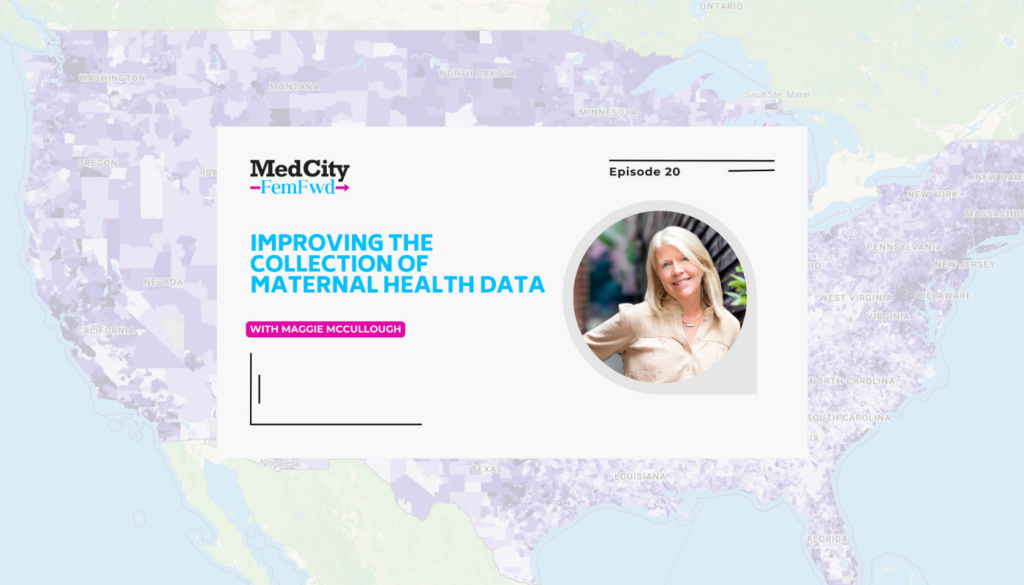
Improving the Collection of Maternal Health Data

Each month on the FemFwd podcast, MedCity News reporter Marissa Plescia explores key issues in women’s health with industry leaders. This month, she sits down with PolicyMap CEO Maggie McCullough to uncover flaws in how maternal health data is collected. Discover McCullough’s insights on how better data can lead to better outcomes.

Read More
UPCOMING WEBINAR – REGISTER NOW!
Interact for health

The Role of Geography in Healthcare

Join us Thursday June 5th at 1:00pm EST for the next MapChats webinar: The Role of Geography in Healthcare.

The session will explore the importance of spatial data and geospatial analysis in transforming healthcare, from improving population health and the efficiency of health systems to advancing innovations in life sciences and pharma.

Our expert panel includes Ken Gross, VP of Real World Evidence at Royalty Pharma & Arrian Nassel, Director of Geospatial Data Visualization at the Lister Hill Center for Health Policy.

Register Here

ON THE BLOG
Interact for health

Digging Deeper: Mapping Maternal Health

Maternal health is a pressing issue in the United States, highlighted by decreases in obstetric services and increasing maternal morbidity. PolicyMap users can integrate datasets like area demographics, chronic health conditions, deprivation indexes, and poverty rates for a nuanced understanding of maternal health challenges. Explore how this powerful tool can improve help outcomes and advance equitable care.

Read More

Interact for health

Understanding Where Maternal Vulnerability is Greatest in the United States

Healthcare for women has been a longstanding problem in the United States for numerous reasons including cost, access, insurance coverage, and state and federal policies. In 2022, over 22 women died for every 100,000 live births. Explore the data behind this urgent public health crisis.

Read More

Updated Data

The latest ACS update is here, with 1,078 new-to-PolicyMap indicators now available! Highlights include:

Housing Costs by Race & Ethnicity: Nine new race- and ethnicity-specific tables show housing costs as a percentage of household income (>30% and >50%) for owners (with/without mortgage) and renters.

Homeowners Insurance Costs by Mortgage Status: New table provides yearly homeowners insurance costs for both owners with and without a mortgage.

Ancestry Data for AIAN Populations: A new ancestry table for American Indian and Alaska Native alone populations, now based on selected tribes and villages (no longer grouped, per tribal consultation feedback).

Expanded Age and Sex Breakdowns: More detailed age data, including breakdowns by sex and a new proxy indicator for females of reproductive age (15–49).

Disability Data: Disability indicators now further disaggregated by age, sex, and veteran status.

Seniors Data: New indicators on poverty status, SNAP participation, and employment status for older adults.

Medicaid and Medicare Data: Expansions on Medicaid enrollment by age groups (under 19, 19–64, and 65+) and by sex, along with Medicare enrollment by sex.

Education Data: New indicators include age and sex disaggregation for educational attainment and school enrollment.

Home Heating Fuel Types: Break out for coal, wood, and solar as separate categories for home heating fuel.

Owner- and Renter-Occupied Housing by Tenure: Expanded indicators include both owner-occupied and renter-occupied units by tenure type.

Homeowner Monthly Costs by Mortgage Status: Details owner‑occupied units’ monthly housing costs by mortgage status.

We are committed to our promise of curated, cleaned, standardized, and always updated data. We’re posting real-time updates on our website, X (formerly known as Twitter) and BlueSky.
In case you missed it

Love PolicyMap? Let us know!

We want to hear from our subscribers! Take 2-3 minutes to tell us about your experience using PolicyMap. We appreciate your feedback!

Open PolicyMap Training Sessions
Offered twice a week. Register here.

Level 1:
Learning the basics of PolicyMap

Level 2:
Learn the Data Loader, Multi-Layer Maps, and other Advanced Features

Open to non-subscribers. Course times rotate weekly. Don’t see a time that works for you?
Contact us.

Upcoming Events

Join Us!

DIA 2025 Global Annual Meeting
June 15-19, 2025
Washington, DC

PolicyMap is exhibiting at DIA 2025 – find us at booth #1710. The event brings together regulatory, clinical, safety, and operational leaders to confront shared challenges and design smarter, faster, more connected solutions. From real-time FDA insights to global regulatory and multi-disciplinary collaboration, this is where silos break down and progress accelerates. We hope to see you there. Register here!