| |
| |
|
| |
A NOTE FROM THE POLICYMAP TEAM |
| |
| |
Let’s Recap 2022 Together
Another year comes to a close! We hope you’re enjoying the holiday season, and wish you and yours health and prosperity in the new year! We are enormously grateful for the incredible PolicyMap community and look forward to helping you gain even more insights for your work in 2023. Stay tuned for more data, new tools and content.
If you’re in a blog-reading mood during this holiday season, we’ve rounded up the year’s top posts. Here goes…
|
|
| |
|
|
| |
| |
STANDOUT STORIES FROM 2022 |
| |
| |
 |
|
Understand the Racial Homeownership Gap Using Ownership Data from PolicyMap
Use new indicators created by PolicyMap to measure the racial homeownership gap in areas throughout the United States. These measures make it possible to compare numerous geographies, understand where disparities lie and create policies that can improve disparities.
Read More |
| |
 |
|
High Speed Broadband: Definitions Matter
Living through the pandemic these last two years shed light on and magnified inequalities that exist across communities in the US. Chief among them – access to the internet.
The interactive, block level FCC broadband data enables users to evaluate pandemic-era broadband coverage and speed. From telemedicine to remote learning, to work-from-home opportunities, to vaccine availability, access to reliable, fast internet impacted how well households were able to weather the strains of the pandemic.
Read More |
| |
 |
|
Find Neighborhoods Facing Health Disadvantages with the Area Deprivation Index
To help identify neighborhoods that are most health-disadvantaged, we’ve added a new dataset to PolicyMap to help researchers, policymakers, and practitioners guide resources and outreach efforts to the places that need it the most. This information is provided by the University of Wisconsin School of Medicine and Public Health (UWSMPH) Center for Health Disparities Research, who have published the Area Deprivation Index to summarize the socioeconomic conditions that can contribute to poor health outcomes.
Read More |
| |
 |
|
Identify Incentivized Locations for Solar, Wind, and EV Charging Facilities Using PolicyMap
When it comes to energy and climate change, the new Inflation Reduction Act sets forth a series of incentives and direct investments for projects designed to reduce carbon emissions, increase energy innovation and support underserved communities. As a result, a number of these incentives are designed to support clean energy investments in very specific low-income communities around the country. PolicyMap can help make the identification of these places simpler.
Read More |
| |
 |
|
Understand How Home Sale Trends Can Signal Adversity for Prospective Home Buyers
Housing market trends are top of mind for current and prospective homeowners as the past two years of the pandemic have ushered in skyrocketing home sale prices and record-low home purchase inventory. PolicyMap now provides data from a best-in-class home sale vendor at the zipcode level to reveal challenges and opportunities presented by home sale price fluctuations.
Read More |
| |
 |
|
Access Local Health Data with CDC PLACES
Looking for better local health data? Over the summer, we added the CDC PLACES dataset to replace, update, and improve upon two of PolicyMap’s previous datasets: our custom Small Area Health Data dataset, and the CDC’s 500 Cities dataset. Premium subscribers can analyze population-level health conditions and risk factors and estimate community health measures at the City, County, ZCTA and Census Tract level.
Read More |
| |
 |
|
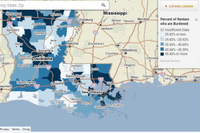
Rising Home Sale Prices and the Risk of Renter Displacement
Almost every county in the nation has experienced an increase in home sale prices and, for some, the growth has been extreme. Understanding where affordable housing may be most under pressure is essential for housing practitioners as they create affordable housing solutions for their communities.
Read More |
| |
 |
|
ACS Data Updated to 2016-2020
PolicyMap provides 2020 Decennial Census and 2016-2020 Census American Community Survey (ACS) data through our maps, charts, reports, and download feature. Because the Census data represents a cornerstone of the PolicyMap platform, these 2020 updates can be found in every single menu in our platform.
Read More |
| |
 |
|
Invest In Safer Streets For Everyone Using The EPA’s National Walkability Index
Walking is good for our health and good for the planet. The EPA’s National Walkability Index captures the many factors shown by research to increase walking in a single index. Learn how to use the EPA’s Smart Locations Database to improve pedestrian safety in your neighborhood.
Read More |
| |
 |
|
Prepare For Hurricanes with Data on Resiliency and Vulnerability
As the United States braced for Hurricane Ian to make landfall in September, our team thought about the emergency management officials readying to respond. A number of indicators in PolicyMap can help identify which communities may have the most difficulty dealing with the natural disaster, including the Baseline Resilience Indicators for Communities (BRIC) and the Social Vulnerability Index (SVI).
Read More |
| |
 |
|
Understand Grade-Schoolers’ Internet and Computer Access in an Era of Remote Education Using New ACS Data
With the 5-year estimates from the 2016-2020 ACS datasets on “Computer & Internet Access by Grade,” you can examine the rural-urban divide in internet and computer access, analyze the discrepancy in access among low-income communities, and understand the potential effects of government policies that expand infrastructure and provide affordable internet plans.
Read More |
| |
 |
|
Assess Hospital Quality of Care with the Hospital Compare Dataset
The ability to evaluate key quality of care measures across different hospitals can help researchers, policymakers, insurance providers, and even individuals begin to assess trends in health care in a given area.
Areas with lower ranked hospitals may be able to use these types of analyses to begin formulating plans to increase their rankings, while higher ranked hospitals can investigate ways to further solidify their rankings and address some of the disparities.
Read More |
| |
|
|
| |
| |
| |
 |
| |
We’re Hiring!
PolicyMap is growing. We currently have openings for a Chief Growth Officer and a Marketing Associate. To learn more and apply, visit our careers page.
Your Feedback Is Important To Us
Love PolicyMap? Leave us a review! Take 2-3 minutes to tell us about your experience using PolicyMap. To thank you for your time, we are offering $10 gift cards. Want to suggest new data or request platform features? Contact us.
Open PolicyMap Training Sessions
Offered twice a week. Open to non-subscribers. Course times rotate weekly. Register here.
Level 1: Learning the basics of PolicyMap
Level 2: Learn the Data Loader, Multi-Layer Maps, and other Advanced Features
|
|
|
| |
|
|
| |
| |
|