
QCEW vs. CBP: The Ultimate Showdown
Recently, we let you know about new data we added from the Bureau of Labor Statistics’ Quarterly Census of Employment and Wages (QCEW). Keen PolicyMap users might be saying now, “Gee, industry-specific employment data…isn’t that a lot like your data from Census County Business Patterns?” The answer is yes. Each has its advantages.
Census Country Business Patterns advantages:
- Data goes down to the zip-code, so you can get much more granular data than QCEW’s county-level data.
- Includes both number of jobs and percent of jobs, so you can see how big an industry is to a particular area’s economy.
QCEW advantages:
- Contains wage data.
- Data is one year newer than CBP (2011 data instead of 2010). In this recovering economy, a lot’s happened since 2010, and this way you can see it.
- QCEW pulls data from a larger number of establishments than does County Business Patterns, so the data may be more accurate.
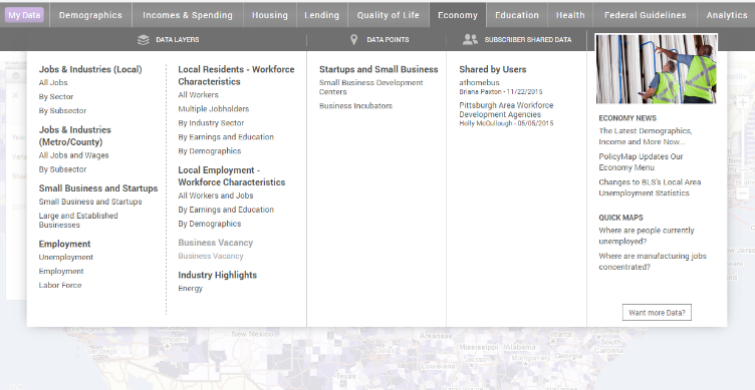
Because each has its advantages, we’re providing both on PolicyMap, in the Jobs & Economy tab, in the submenus in the “Jobs & Wages” section. Because CBP contains the more granular zip-code level employment data, that is in the “Jobs” section of the submenus. Because the QCEW data contains wage data, that’s in the “Wages” section of the submenus, even though it also includes some employment data.
Which works better for you? Let us know, by e-mailing us at info@policymap.com.