
Announcing seasonal flu trends data
As PolicyMap collectively recovers from an unusual barrage of snow days and sick days, we feel it is rather appropriate to announce the addition of a new public health dataset: seasonal flu. To many, seasonal influenza can be a minor winter annoyance, but the spread of the disease is of great concern to vulnerable populations. So where does data come in? There are a variety of ways to track influenza: the World Health Organization observes flu activity around the world through a network of reporting mechanisms, and Google Flu Trends collects data globally by mining user searches for keywords. Your own state or county health department most likely tracks influenza illnesses and deaths in detail. And the scale of the data is not the only aspect to consider: the strain of the flu that is currently causing illness, be it H1N1, H3N2, or Influenza B, is important information used to develop and improve vaccines.
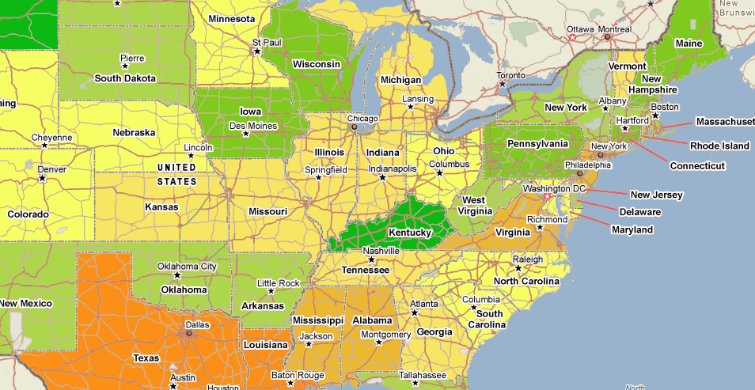
The seasonal influenza data on PolicyMap features a national, state-level source from the CDC’s Flu Activity and Surveillance Report. To compare flu activity geographically, the CDC provides both a measure of how intense the flu activity is by state, as well as a categorical indicator of how widespread the flu is within the state – is a severe outbreak limited to one locality, for example, or is there moderate activity in every county or region within the state? The map below shows the most recent flu activity level for this season.
<
Those who insist that cold weather doesn’t make you sick might be on to something!
We have condensed the CDC’s weekly flu reports into seasonal values, which can be found in the Health tab under Infectious Disease. These data will be updated annually during flu season.