
School Districts with free & reduced price lunch in 2009
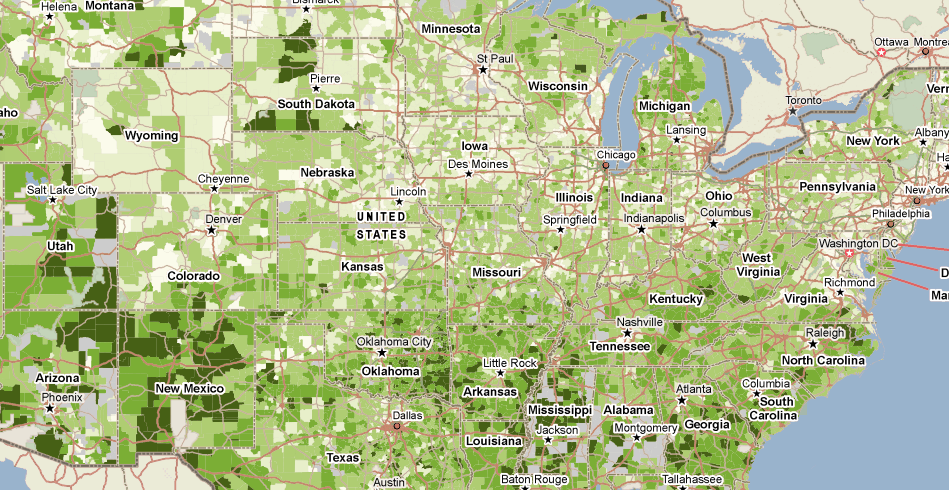
With many states facing tough economic challenges, school programs are sometimes the first to be cut. To see where this might have the greatest effect, let’s see which school districts have the most students in need. This number is calculated by TRF using the 2009 recipients and the 2009 counts of students as reported in the Common Core of Data from the National Center for Education Statistics. The total number of Eligible Free and Reduced Price Lunch recipients participating in the Free and Reduced Price Lunch Program by school district in 2009 divided by the total number of students in each school district in 2009.
| School District, State | Percentage Receiving Free/Reduce Lunch | |
|---|---|---|
| Forrest City SD, AR | 99.59% | |
| Gadsen Elementary District, AZ | 99.54% | |
| North Forest ISD, TX | 99.54% | |
| Claiborne County SD, MS | 99.49% | |
| Durant Public SD, MS | 99.48% | |
| West Memphis SD, AR | 99.40% | |
| Blytheville SD, AR | 99.33% | |
| Helena-West Helena SD, AR | 99.33% | |
| Woodville Elementary, CA | 99.33% | |
| Quitman County SD, MS | 11.9% |
Do you want to learn more about this dataset or other features on PolicyMap? Join our free weekly trainings (Click Here) or send your questions to pmap@policymap.com.
![]()